
Key findings
This study tracks customs imports under HS 901849 across selected destinations. HS 901849 is a dental category that is broader than hand instruments. Recorded imports across a fixed panel of 37 destinations rose from $4,138.26 million in 2019 to $5,207.26 million in 2024. That is an increase of $1,069.00 million, or 25.83%, in current US dollars. The figures are our calculations from the WITS 2019 and WITS 2024 import records.
The latest full year gives a different result. Across a matched panel of 33 destinations, recorded imports fell 4.26% between 2024 and 2025. Most of the panel did not fall. The median destination grew 2.57%. US recorded imports fell by more than the whole panel's net decline (WITS 2025).
- 2019–2024, 37 destinations: the aggregate rose 25.83%, which is a compound annual growth rate (CAGR) of 4.70%. The median of the 37 individual country CAGRs was 4.81%.
- Breadth: 31 of 37 destinations ended 2024 above their 2019 nominal import value. Six ended below it.
- 2024–2025, 33 destinations: the aggregate fell 4.26% (−$219.68 million). The median destination grew 2.57%. Seventeen destinations rose and 16 fell.
- US effect: US recorded imports fell $324.25 million (−25.85%). This contributed −6.28 percentage points to the 33-destination change and was large enough to make the aggregate negative. The other 32 destinations together rose $104.57 million (+2.68%).
- Growth versus scale: no country appears in both the five fastest-growing destinations by CAGR and the five largest dollar increases.
| Period | Destinations | Measure | Change |
|---|---|---|---|
| 2019–2024 | 37 | Aggregate nominal import value | +25.83% |
| 2024–2025 | 33 | Aggregate nominal import value | −4.26% |
| 2024–2025 | 33 | Median country growth | +2.57% |
| 2024–2025 | 32, US excluded | Aggregate nominal import value | +2.68% |
Source: UN Comtrade via World Bank WITS · HS H0 901849 · Own fixed-cohort calculations.
How dental instrument imports changed from 2019 to 2024
The long-run panel uses the same 37 destinations in every year from 2019 to 2024. A change in the total therefore reflects changes in recorded imports. It does not reflect countries entering or leaving the sample.
With 2019 set to 100, the aggregate index was:
- 2020: 90.49 (−9.51% on the year)
- 2021: 124.08 (+37.13%)
- 2022: 123.65 (−0.35%)
- 2023: 121.47 (−1.76%)
- 2024: 125.83 (+3.59%)
In dollar terms, the panel total was $3,744.54 million in 2020, $5,134.72 million in 2021, $5,116.86 million in 2022 and $5,026.91 million in 2023. Source records for each year: 2019, 2020, 2021, 2022, 2023, 2024.
Dental-category import trends, 2019–2024

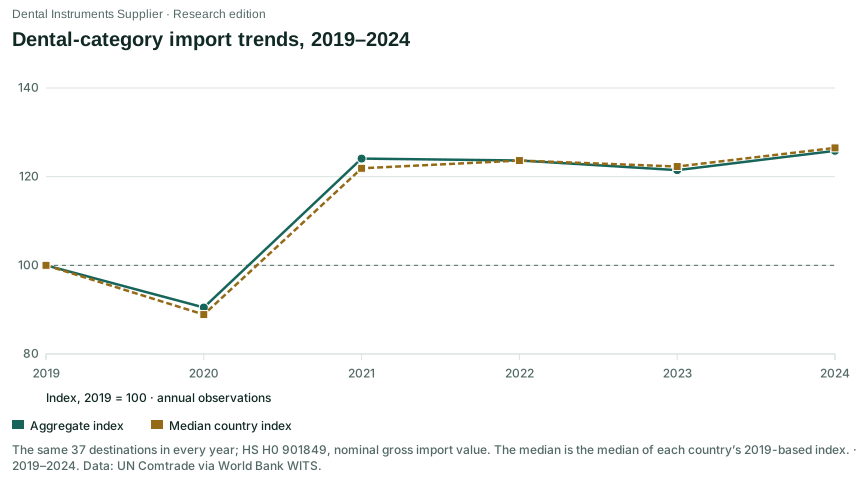
The chart also shows a second line, the median country index. To build it, we indexed each destination to its own 2019 value and then took the median. This measure gives every country equal weight. The aggregate, by contrast, is weighted by import value. The median index was 88.90 in 2020, 121.89 in 2021, 123.63 in 2022, 122.29 in 2023 and 126.49 in 2024.
The two lines stay close throughout the period, and 31 of 37 destinations finished above their 2019 level. The long-run rise was therefore not confined to the largest reporters. The six destinations below their 2019 value in 2024 were China, Kuwait, Malaysia, Myanmar, the Philippines and Sri Lanka.
Did dental instrument imports fall in 2025?
The total fell, but the typical destination did not. The two answers come from different measures.
Across the 33 destinations with matched 2024 and 2025 records, recorded imports fell from $5,160.79 million to $4,941.10 million. That is a decline of $219.68 million, or 4.26%. The median destination changed by +2.57%. Seventeen destinations rose and 16 fell.
The total and median country moved in opposite directions

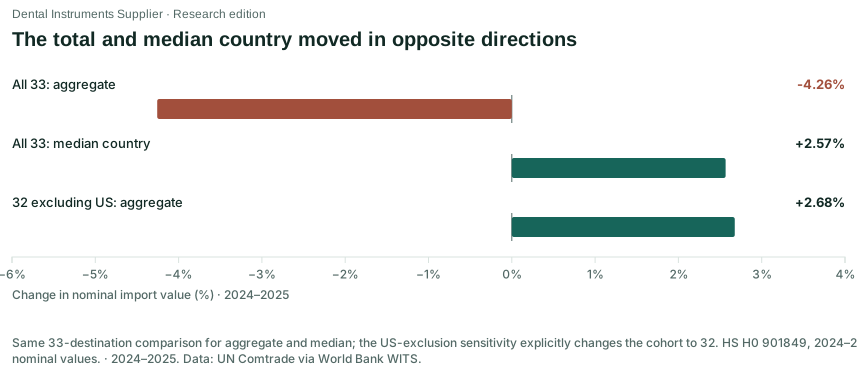
The US decline was large enough to make the 33-destination aggregate negative, while the other 32 destinations together increased. US recorded imports fell from $1,254.17 million in 2024 to $929.92 million in 2025, a change of −$324.25 million or −25.85%. The United States carried a large share of the panel's 2024 value, so this one change subtracted 6.28 percentage points from the 33-destination aggregate change.
The remaining 32 destinations rose $104.57 million, or 2.68%. The dollar figures reconcile exactly: −$324.25 million plus $104.57 million equals the panel's net change of −$219.68 million.
The US decline exceeded the panel’s net decline

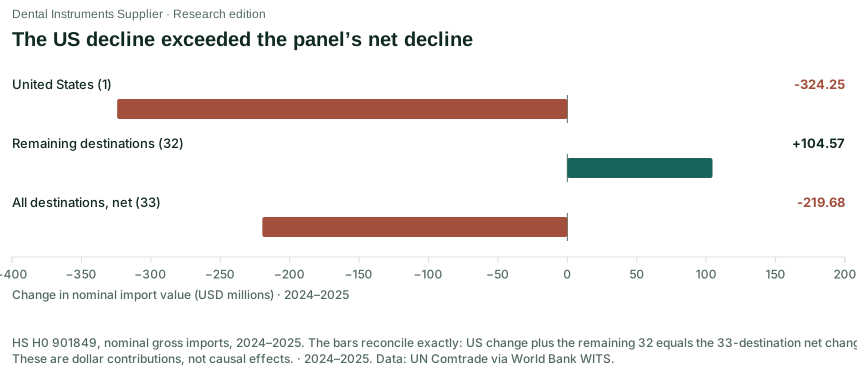
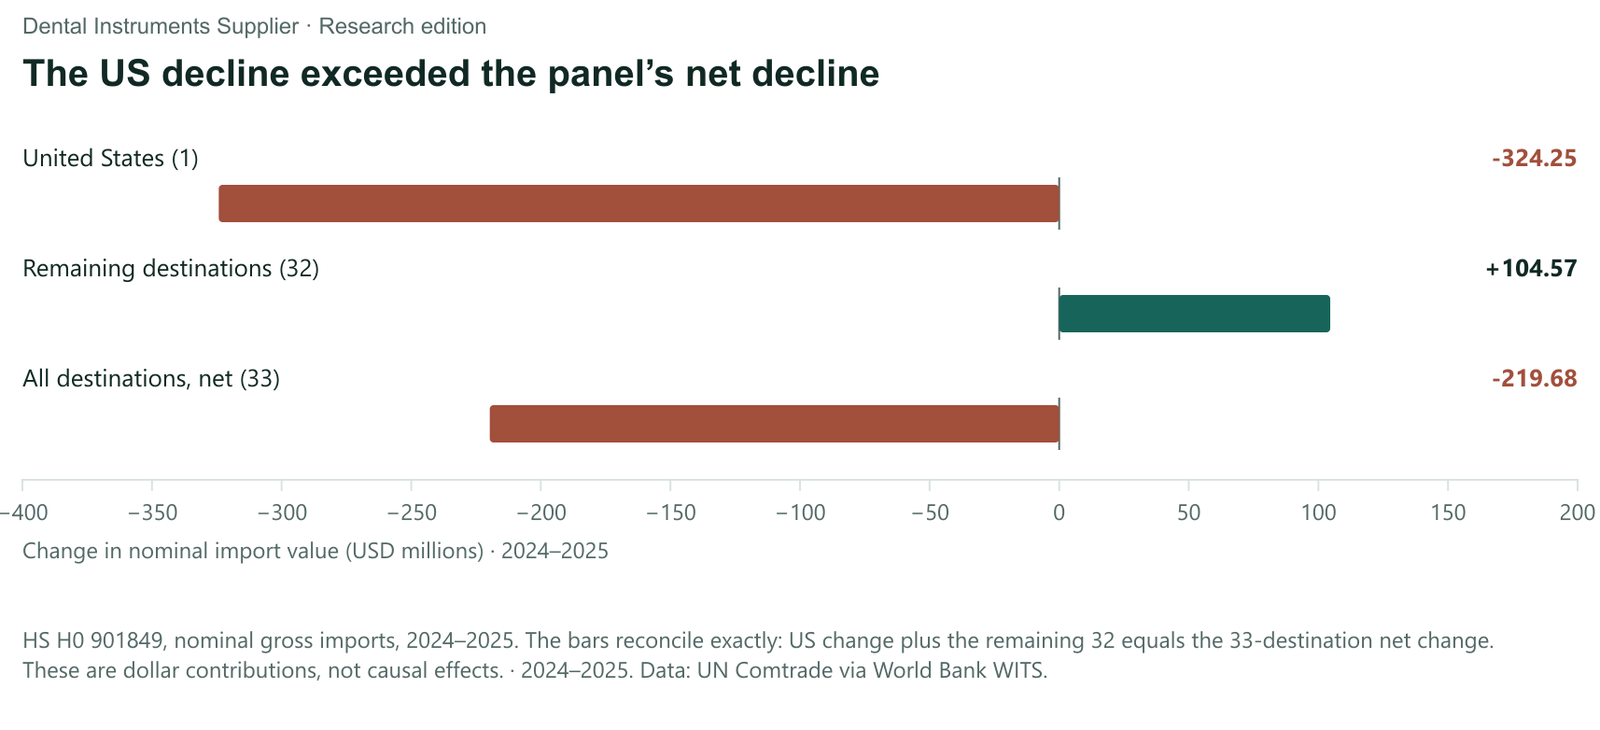
The US contribution shows why the value-weighted total turned negative. It does not fully account for the 6.82-point gap between the aggregate (−4.26%) and the median (+2.57%). A median cannot be split into country contributions in the way a sum can. The percentages also use different bases. The −6.28-point US contribution is measured against the 33-destination total, while the +2.68% no-US figure is measured against a 32-destination total. For this reason, the two percentages should not be added together.
The contribution is an accounting identity. It shows where the dollar change sits, not why it happened, and it does not imply any effect of the United States on other countries. The US customs reporter also covers Puerto Rico and the US Virgin Islands. The figure is therefore a reporter total, not a measure of mainland US demand.
Country-by-country changes, 2024–2025
The table lists recorded imports in 2024 and 2025 and the change for each of the 33 matched destinations.
| Destination | 2024, USD m | 2025, USD m | Change, % | Change, USD m |
|---|---|---|---|---|
| Australia | 135.73 | 116.08 | -14.47% | -19.65 |
| Azerbaijan | 2.63 | 3.28 | +24.55% | 0.65 |
| Belgium | 117.65 | 61.44 | -47.78% | -56.21 |
| Brazil | 83.38 | 71.82 | -13.86% | -11.56 |
| Canada | 313.88 | 321.93 | +2.57% | 8.06 |
| Chile | 24.09 | 23.26 | -3.46% | -0.83 |
| China | 197.97 | 174.25 | -11.98% | -23.71 |
| Colombia | 18.54 | 23.64 | +27.51% | 5.10 |
| Egypt | 16.65 | 18.01 | +8.21% | 1.37 |
| France | 372.51 | 384.71 | +3.27% | 12.19 |
| Germany | 635.42 | 725.39 | +14.16% | 89.97 |
| Hungary | 11.35 | 11.16 | -1.65% | -0.19 |
| Italy | 208.19 | 206.27 | -0.92% | -1.92 |
| Japan | 276.48 | 237.11 | -14.24% | -39.37 |
| Kuwait | 15.34 | 19.41 | +26.53% | 4.07 |
| Malaysia | 19.79 | 30.23 | +52.75% | 10.44 |
| Mexico | 88.57 | 96.43 | +8.88% | 7.86 |
| Myanmar | 0.13 | 0.18 | +31.83% | 0.04 |
| Netherlands | 420.58 | 476.83 | +13.38% | 56.25 |
| Philippines | 4.47 | 4.92 | +10.19% | 0.46 |
| Poland | 128.10 | 168.73 | +31.72% | 40.63 |
| Portugal | 49.80 | 47.44 | -4.74% | -2.36 |
| Saudi Arabia | 91.83 | 96.34 | +4.92% | 4.52 |
| Singapore | 23.52 | 22.48 | -4.44% | -1.04 |
| Slovakia | 21.16 | 19.11 | -9.69% | -2.05 |
| South Africa | 15.76 | 14.22 | -9.77% | -1.54 |
| South Korea | 93.76 | 88.34 | -5.79% | -5.42 |
| Spain | 193.66 | 199.85 | +3.20% | 6.19 |
| Sri Lanka | 0.36 | 0.33 | -8.54% | -0.03 |
| Thailand | 36.63 | 35.52 | -3.03% | -1.11 |
| Turkey | 95.01 | 103.16 | +8.59% | 8.16 |
| United Kingdom | 193.70 | 209.32 | +8.06% | 15.62 |
| United States | 1,254.17 | 929.92 | -25.85% | -324.25 |
Source: UN Comtrade via World Bank WITS · HS H0 901849 · Own fixed-cohort calculations. Download exact country data
Fast percentage growth and large dollar gains point to different countries
Over 2019–2024, the five highest CAGRs in the 37-destination panel belonged to Uzbekistan, Saudi Arabia, Turkey, Ukraine and Singapore. The five largest dollar increases were in the United States, Germany, France, Japan and Canada. No country appears in both lists.
Percentage growth and dollar growth identify different countries

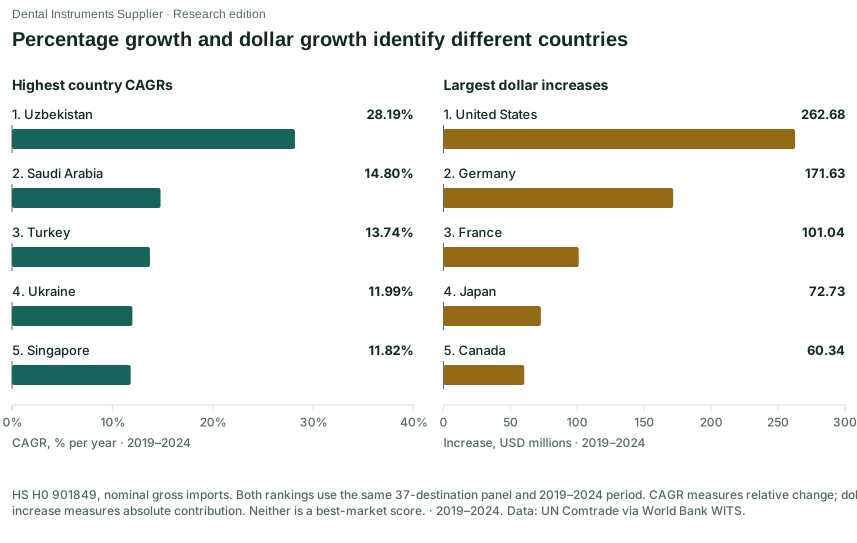
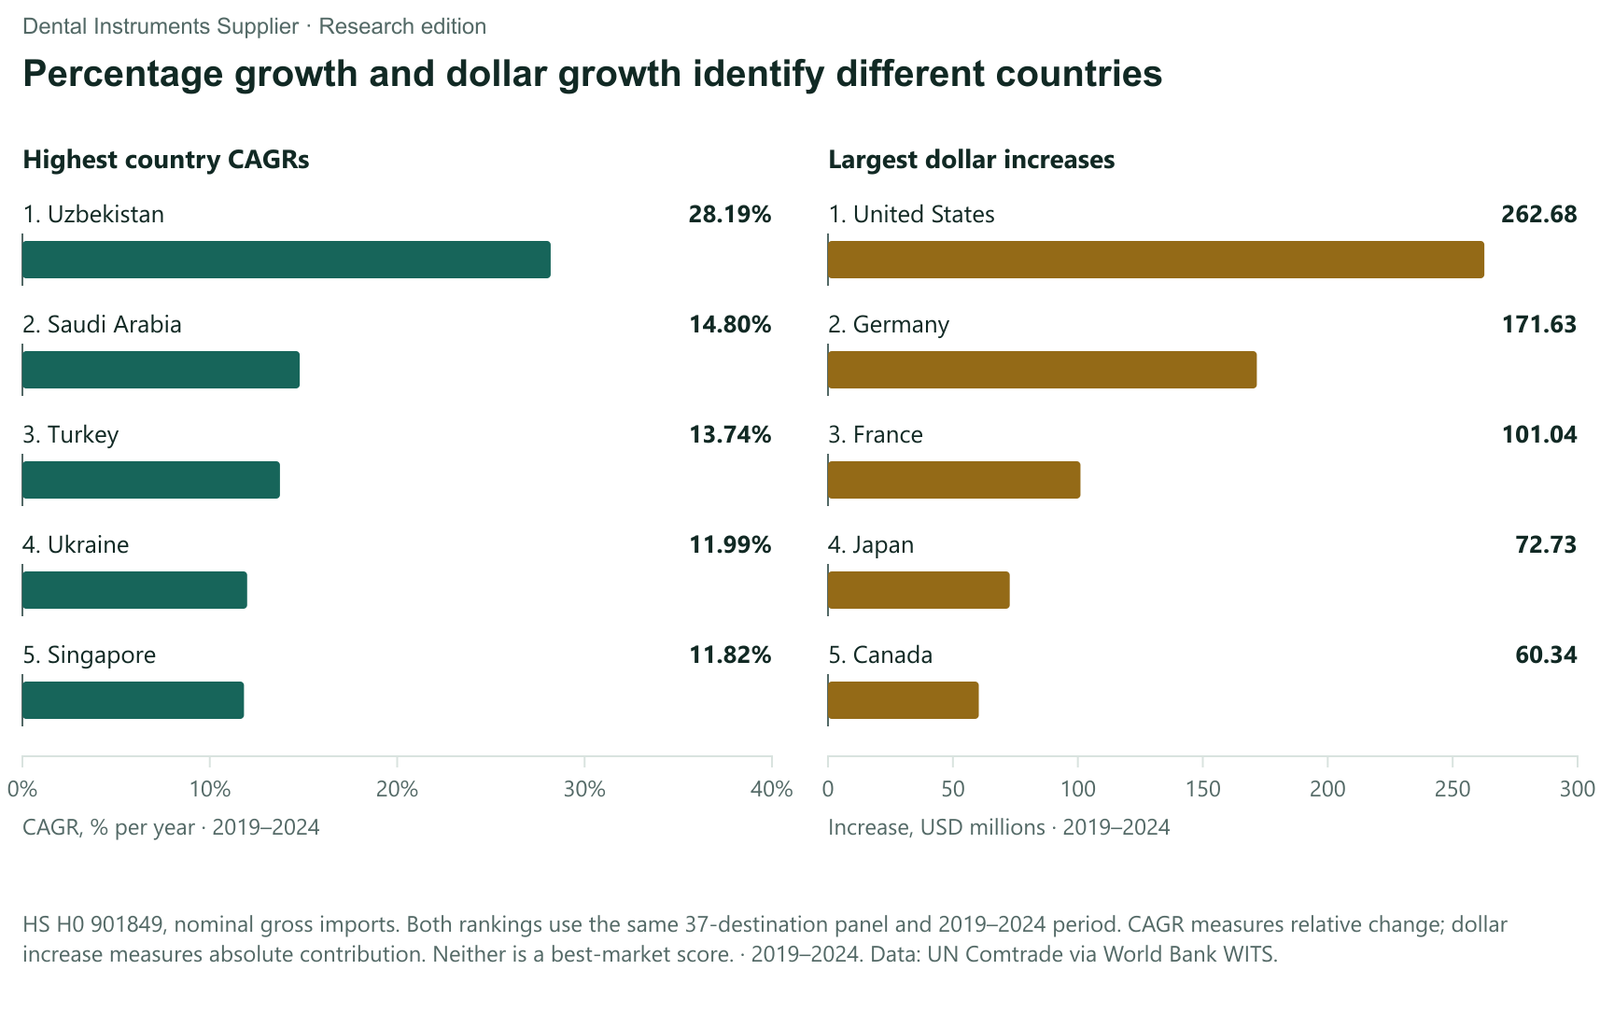
Uzbekistan illustrates the small-base effect. Its recorded imports rose from $0.75 million to $2.59 million. That is a 246.16% increase and a CAGR of 28.19%, but it added only $1.85 million, or 0.04 percentage points of the panel's growth.
US recorded imports grew from $991.49 million to $1,254.17 million, a CAGR of 4.81%. The United States added $262.68 million and contributed 6.35 percentage points to the panel's 25.83% rise. Uzbekistan accounted for 0.02% of the panel's 2019 value, while the United States accounted for 23.96%.
One ranking measures relative change and the other measures absolute contribution. Neither is a score of market attractiveness, and neither country is presented here as a better destination.
Why the matched panel matters for the 2025 figure
Four destinations in the 2024 panel had no 2025 record in our retained source extract: Qatar, Tunisia, Ukraine and Uzbekistan. Together they recorded $46.47 million of imports in 2024.
A naive method would compare all 37 destinations in 2024 with the 33 that reported in 2025. That method gives a decline of 5.11% instead of 4.26%. About 0.85 percentage points of the apparent fall would then come only from the change in coverage.
The matched 33-destination panel still covers 99.11% of the 37-destination panel's 2024 import value. A missing row is not a zero, and it is not evidence that no newer release exists. We show the naive figure only to explain why we do not use it as the headline.
What HS 901849 does and does not cover
The analysed code is HS 901849 in the HS 1988/92 (H0) nomenclature: Other instruments and appliances, used in dental sciences: other (UN Comtrade H0 reference). It sits under heading 9018, which covers instruments and appliances used in medical, surgical, dental or veterinary sciences.
The code is broader than reusable dental hand instruments and narrower than all dental equipment. It excludes the sibling code 901841, which covers dental drill engines.
UN Comtrade warns that converting newer national data to an older classification can capture more or fewer products than the official heading. The same H0 code does not guarantee an identical product mix across countries or years.
Methods and definitions
Scope
- Classification: HS 901849, HS 1988/92 (H0), as labelled by WITS. The UN reference class name is HS1992.
- Flow: gross imports from all partners (World), as reported by each customs reporter.
- Units: current nominal US dollars. WITS displays values in thousands. We multiplied displayed values by 1,000 using decimal arithmetic, then divided by one million for publication. We made no adjustment for inflation or exchange rates and calculated no volumes.
- Valuation: WITS metadata generally describe imports as CIF, but national practices can vary (UN Comtrade disclaimer).
- Panels: an annual 2019–2024 panel of 37 destinations and an annual 2024–2025 panel of 33 destinations. 2026 is the edition year, not an observation year. The 2025 values are full-year records, not 2026 year-to-date estimates.
Country cohort. The universe is the 41 destinations listed in the DIS enquiry-market directory (markets we serve). Being listed in the directory does not indicate that DIS has received enquiries from, or shipped to, a destination. Pakistan is not included as a destination. The cohort is a descriptive convenience cohort. It is not a representative sample and does not represent the global dental market. Russia, Taiwan, the United Arab Emirates and Vietnam are excluded from both panels because matched retained records were not available. Taiwan was not mapped to the Other Asia reporter group. Qatar, Tunisia, Ukraine and Uzbekistan are also excluded from the 2024–2025 panel. EU and World aggregate groups were excluded. No missing value was imputed as zero.
Aggregate and median. Aggregate growth is the ratio of fixed-panel sums. This is equivalent to an average of country growth rates weighted by baseline value. The median is the median of individual country percentage changes, so each country counts equally. Country contributions add up to the aggregate change, but they cannot be used to decompose the median. CAGR equals 100 × ((end ÷ start)^(1/5) − 1). The no-US figure is a sensitivity scenario that changes the cohort to 32 destinations and therefore uses a different denominator from the 33-destination contribution figures.
What these figures cannot show. Gross imports can include re-imports and goods moving through distribution or re-export channels. Summing country flows therefore does not measure unique final sales or domestic consumption. The data do not separate price, quantity, product mix or reporting changes. We infer no causes, forecasts, unit prices, clinical demand, opportunity scores or DIS sales from them.
Geography. The US reporter (code 842) includes Puerto Rico and the US Virgin Islands. The France reporter (code 251) includes Monaco (UN Comtrade reporters list). Border changes and national trade systems may affect individual series, including Ukraine's.
Precision. Source cells are displayed to 0.01 thousand USD, which gives a rounding precision of about ±5 USD per cell. Percentages and USD millions are rounded to two decimals for presentation.
Snapshot and revisions. The original input downloads were made on 13 October 2026. The 2019, 2024 and 2025 tables and the classification sources were checked again on 14 October 2026, and all selected values were unchanged. The 2020–2023 values come from retained snapshots that were not downloaded again for this check. Later source revisions may change the results.
How this study was produced. This is a secondary analysis of official trade data, not an official statistic. The calculations were automated, and the research and drafting were AI-assisted. DIS contributed the destination cohort and the analysis. Corrections to this edition will be recorded in this section with the date and the affected figures.
Attribution. Source data: UN Comtrade, accessed through World Bank WITS. The derived calculations and charts are by DIS. The raw source files are not redistributed.
Frequently asked questions
Is this the size of the global dental instrument market?
No. The figures are summed customs imports for one HS code across selected destinations. They exclude other countries, domestic production and other dental product codes. The code also includes appliances beyond hand instruments.
Why do the 2025 total and the median point in opposite directions?
The total is weighted by import value, so a large fall at one large reporter can outweigh smaller gains elsewhere. The median gives every destination equal weight. In 2025, the US decline was large enough to make the 33-destination total negative, while slightly more than half of the destinations grew. The US contribution does not exactly account for the difference between the two measures, because a median cannot be broken down into country contributions.
Does the US decline mean US dental demand fell?
The data cannot answer that question. They record the nominal customs value of gross imports. They do not measure quantities, prices, inventory, clinical use or final consumption, and we did not test any cause.
Does a high growth rate identify a better export market?
Not by itself. High percentage growth from a small base can add very little value, and a large dollar increase can come with modest percentage growth. Neither measure has been independently validated as an indicator of export opportunity.
Why does this 2026 edition stop at 2025?
In our retained source snapshot of 13–14 October 2026, the latest full-year records for the selected destinations were for 2025. 2026 is the edition year of this analysis, not an observation year, and we do not use partial-year figures.
Check the data
Each chart comes with a downloadable CSV of its exact derived values:
- Fixed-panel trend, 2019–2024 (CSV)
- 2025 total versus median (CSV)
- US contribution to the 2025 change (CSV)
- Growth versus scale, 2019–2024 (CSV)
The calculation tables cover country coverage, long-run country results, 2024–2025 country changes, country contributions, the top-five comparison and the aggregate, median and US sensitivity figures. To check any result, compare it with the linked WITS year pages and apply the formulas in the methods section.
Suggested citation: DIS. Dental Instrument Trade Statistics 2026: Import Trends Across Selected Markets. Observation periods 2019–2024 and 2024–2025. HS H0 901849, UN Comtrade data accessed through World Bank WITS. Data snapshot 13–14 October 2026. Published 14 October 2026. https://dentalinstrumentssupplier.com/research/dental-instrument-trade-statistics-2026.
Article, calculated tables, source-linked claim records and original chart images.
Calculation tables and source-linked claim records
- trade aggregate median US sensitivity
- trade annual fixed37 index
- trade claim ledger
- trade country contribution chart
- trade country coverage
- trade country deltas 2024 2025
- trade fixed cohort trend
- trade full 33 destination comparison
- trade full 37 destination comparison
- trade growth versus dollar top5
- trade growth versus scale
- trade long run country results
- trade total versus median
- trade us contribution