
Key findings
NHS dental statistics for England show that general dental activity grew in the 2025/26 financial year, which ran from 1 April 2025 to 31 March 2026. We calculated the following from the NHSBSA national activity workbook and the NHSBSA workforce workbook:
- Total courses of treatment rose 6.23%. They increased from 35,412,041 to 37,618,010, a net gain of 2,205,969.
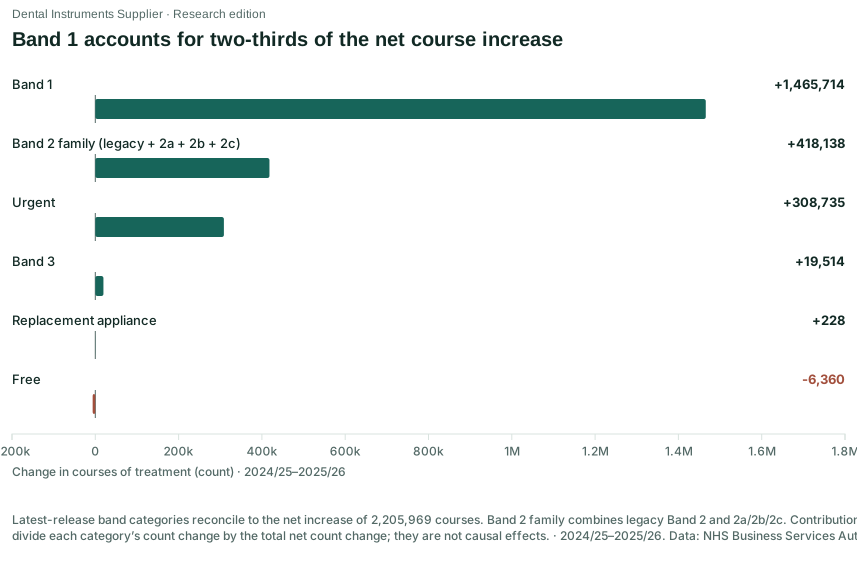
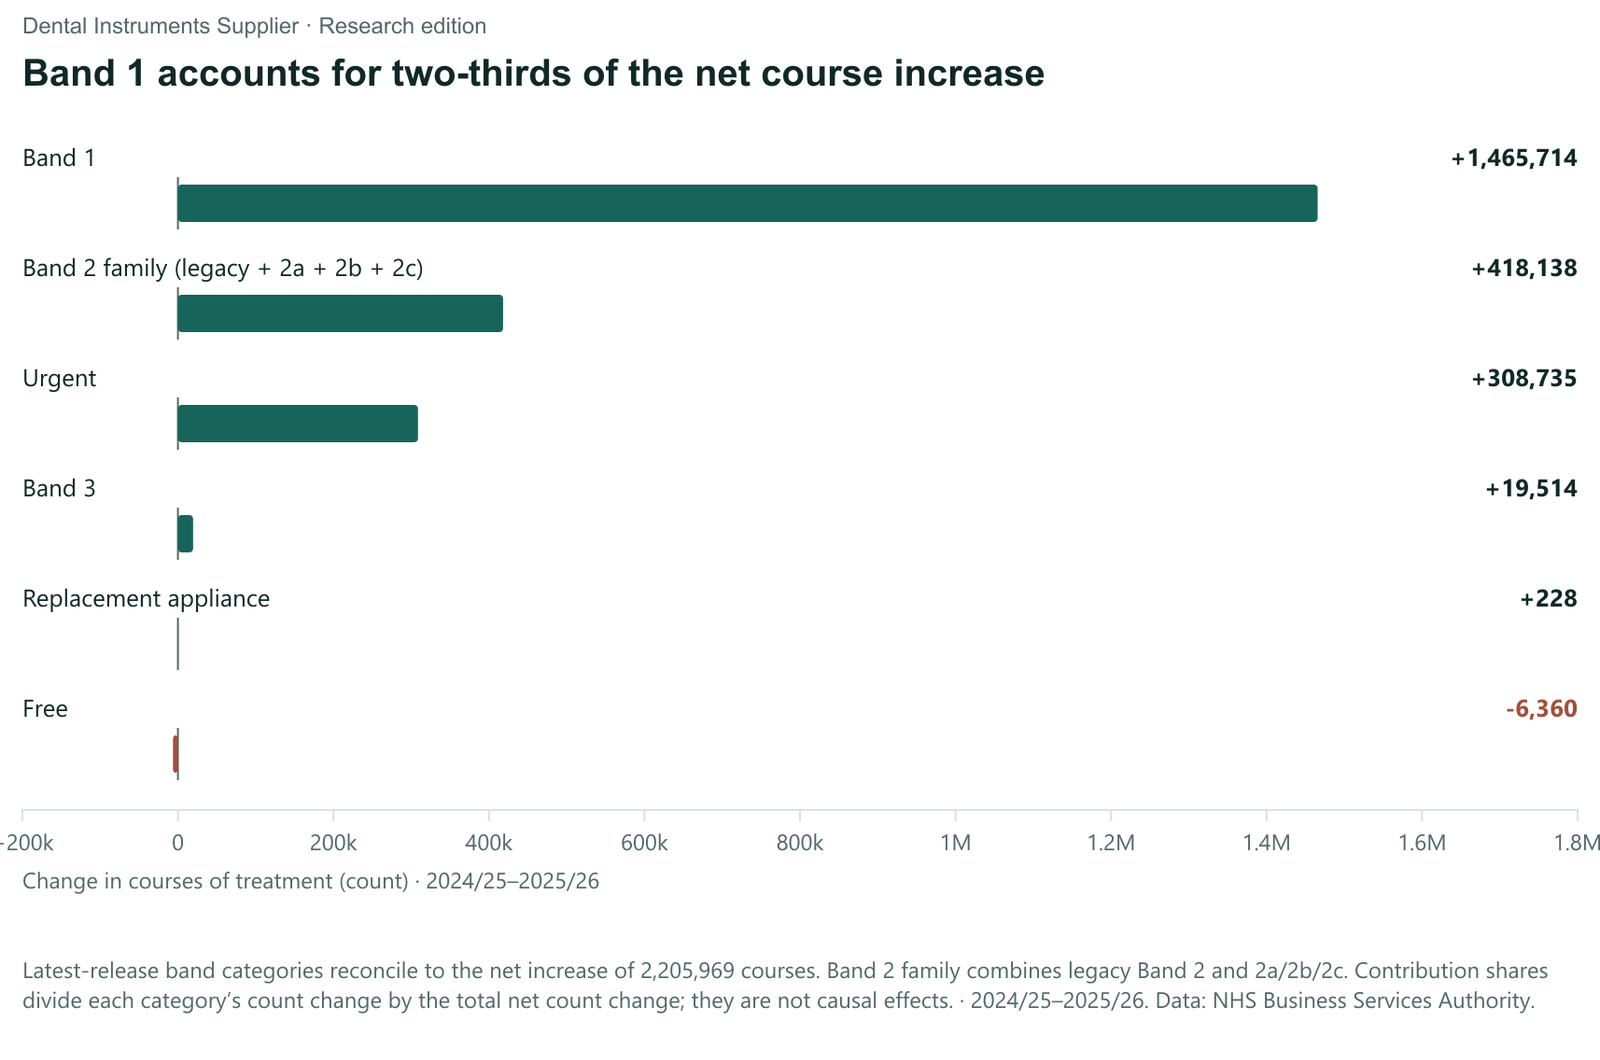
- Band 1 accounted for about two-thirds of the increase. It added 1,465,714 courses, or 66.44% of the net gain. The Band 2 family added 418,138 courses (18.95%), urgent-band courses added 308,735 (14.00%) and Band 3 added 19,514 (0.88%).
- Urgent-band courses grew fastest among the treatment-band categories compared here, at 8.44%. Even so, their share of all courses rose by only 0.21 percentage points, to 10.55%.
- Extraction items and extraction courses moved differently. For adults, estimated extraction clinical treatment items grew faster than extraction-containing courses (4.34% against 3.44%). For children, items grew more slowly than courses (4.70% against 5.40%).
- NHS-active dentist headcount rose by 764 to 25,419 (3.10%). This equals 2,323 joiners minus 1,559 leavers.
The figures have two different scopes. Course and extraction figures cover NHS general dental activity in England only. They exclude private care, NHS hospital dental care and orthodontic courses. Workforce figures are national counts of NHS-active dentist performers with at least one UDA or UOA. Because UOAs are units of orthodontic activity, the headcount is not limited to dentists doing general dental work. None of these figures counts patients.
What units do these statistics count?
The release uses several different units, and mixing them can lead to misleading interpretations.
Four units used in this analysis
- Course of treatment (COT): one valid FP17 claim form for a completed general dental course. One course can involve several visits and several treatment types. A course is not a visit and not a person. (NHSBSA background, section 2.2)
- Extraction-containing course: an estimated count of courses that include at least one extraction.
- Estimated extraction clinical treatment item: an estimated count of extraction items. One course can contain several items.
- NHS-active dentist performer: a dentist with at least one UDA or UOA recorded in GDS, PDS or TDS contracts during the year. Foundation dentists are included and dental care professionals are excluded.
Unique patients are a separate unit. NHSBSA publishes them as patients-seen statistics, which use different time windows for adults and children. This analysis does not use them.
How much did NHS dental activity grow in 2025/26?
| Category | 2024/25 COTs | 2025/26 COTs | Change |
|---|---|---|---|
| Band 1 | 21,404,652 | 22,870,366 | +6.85% |
| Band 2 family | 8,946,461 | 9,364,599 | +4.67% |
| Band 3 | 1,302,839 | 1,322,353 | +1.50% |
| Urgent | 3,658,263 | 3,966,998 | +8.44% |
| Free | 90,192 | 83,832 | -7.05% |
| Replacement appliance | 9,634 | 9,862 | +2.37% |
| All courses | 35,412,041 | 37,618,010 | +6.23% |
Source: NHSBSA latest national activity workbook · General courses exclude orthodontics. Band 2 family combines legacy Band 2 and 2a/2b/2c.
Both years in the table come from the latest workbook. The 2024/25 values are therefore restated on the current method rather than taken from last year's release.
Total courses rose 6.23%. Band 1 grew slightly faster than the total, so its share of all courses rose from 60.44% to 60.80%. Band 3 behaved differently. Its count rose from 1,302,839 to 1,322,353, but its share fell from 3.68% to 3.52% because it grew more slowly than total activity.
Courses in the Free treatment category fell from 90,192 to 83,832. Free is a specific category in the workbook. It does not represent all treatment delivered to patients who are exempt from charges, because exempt patients also receive courses in other treatment bands. Regulation 11 replacement appliance courses rose from 9,634 to 9,862.
Which treatment bands account for the course increase?
The treatment categories in the workbook are mutually exclusive and add up to the total. Each course appears in exactly one category, so the changes across categories add up exactly to the change in total courses. Bands 1, 2 and 3 are assigned according to the most complex treatment in the course. The urgent, Free and Regulation 11 replacement appliance categories follow their own classification rules (NHSBSA background, section 2.2).
We divided each category's change in courses by the national net change of 2,205,969. The result shows how much of the growth each category accounts for.
Band 1 accounts for two-thirds of the net course increase

The results are:
- Band 1: +1,465,714 courses (66.44% of the net increase)
- Band 2 family (legacy Band 2, 2a, 2b and 2c combined): +418,138 (18.95%)
- Urgent: +308,735 (14.00%)
- Band 3: +19,514 (0.88%)
- Regulation 11 replacement appliance: +228 (0.01%)
- Free treatment category: −6,360 (−0.29%)
We combine the Band 2 family because its labels changed over time. Sub-bands 2a, 2b and 2c apply to courses accepted from 25 November 2022. Legacy Band 2 courses fell from 1,896 to 524. As shares of all general dental courses, not of the Band 2 family alone, the sub-bands moved in different directions:
- Band 2a fell from 18.60% to 18.15%.
- Band 2b rose from 6.34% to 6.44%.
- Band 2c fell from 0.32% to 0.30%.
This breakdown is accounting arithmetic. It shows where the extra claims were recorded. It does not establish why activity changed, or show any change in disease severity or clinical need. Each course is counted only once. For example, a Band 3 course can include Band 2-type work, but it is counted only in Band 3.
How did urgent courses change, and why does share differ from growth?
Urgent-band courses rose from 3,658,263 to 3,966,998. Others have already reported this growth. Healthwatch England, for example, linked it to reported difficulty getting care. Our analysis adds reconciled figures for growth rate, share and contribution.
Urgent-band courses grew faster than all courses

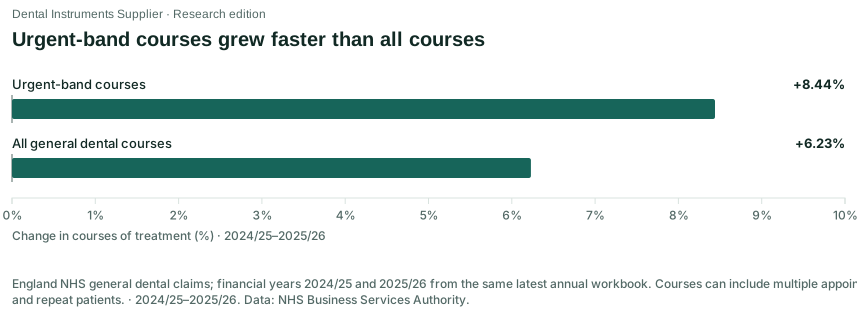
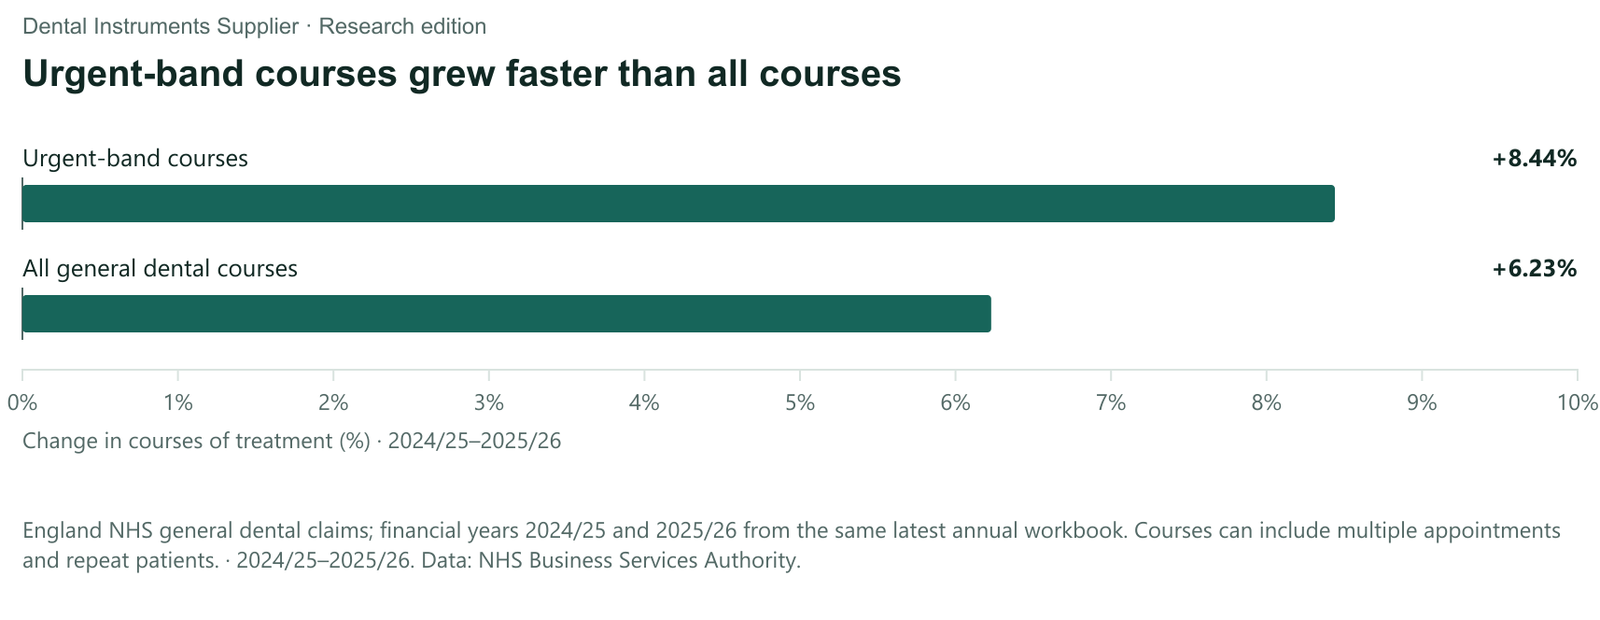
Urgent-band courses grew faster than all general dental courses, at 8.44% against 6.23%. However, they started at about one-tenth of total activity. As a result, their share rose only from 10.33% to 10.55%. Calculated from unrounded shares, that is an increase of 0.21 percentage points. Subtracting the rounded shares shown here would give 0.22.
Urgent-band courses accounted for 14.00% of the net increase. That is more than their 10.55% share of activity, but far less than Band 1's contribution. Growth rate, share and contribution therefore tell different stories. Among the treatment-band categories compared here, urgent-band courses grew fastest, but most of the extra courses were in Band 1.
The urgent band is a claims category for urgent oral conditions. It can include specified interventions, such as up to two extractions and one filling (NHSBSA background, section 2.2). Urgent course counts do not measure unique emergency patients, unmet need or the effect of any incentive.
How do extraction items differ from extraction courses?
The release publishes extraction data in two forms. Tables 5a and 5c estimate how many courses contained an extraction. Tables 5b and 5d estimate how many extraction clinical treatment items were recorded. The extraction category includes routine extractions and specified surgical removals, such as buried roots and unerupted, impacted or exostosed teeth (NHSBSA background, section 2.3).
| Group | Year | Estimated extraction-containing COTs | Estimated extraction items | Items/COT |
|---|---|---|---|---|
| Adults | 2024/25 | 1,679,097 | 2,443,333 | 1.46 |
| Adults | 2025/26 | 1,736,920 | 2,549,342 | 1.47 |
| Children | 2024/25 | 518,005 | 896,718 | 1.73 |
| Children | 2025/26 | 545,958 | 938,822 | 1.72 |
Source: NHSBSA Tables 5a–5d · Ratios are own calculations from published estimates; ages use the latest-release restated classification.
To compare the two forms, we divided items by courses. The result is the number of items per extraction-containing course.
- Adults: courses rose 3.44% and items rose 4.34%. Items per course rose from 1.46 to 1.47, an increase of 0.87%.
- Children: courses rose 5.40% and items rose 4.70%. Items per course fell from 1.73 to 1.72, a decrease of 0.67%.
All changes were calculated from unrounded counts and ratios, not from the two-decimal ratios displayed.
More child extraction activity, with a slightly lower items-per-course ratio

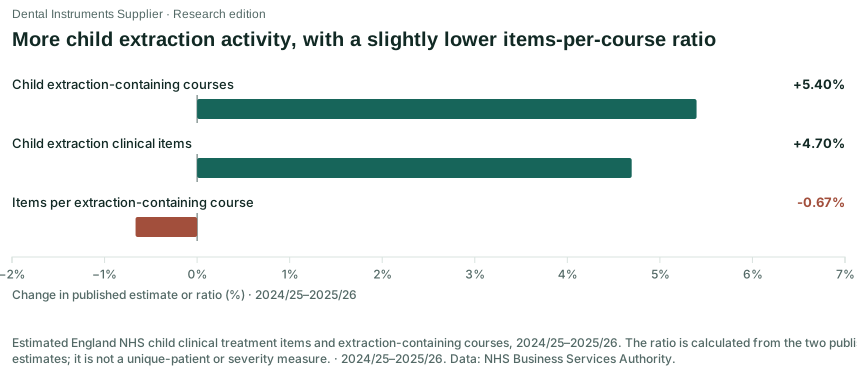
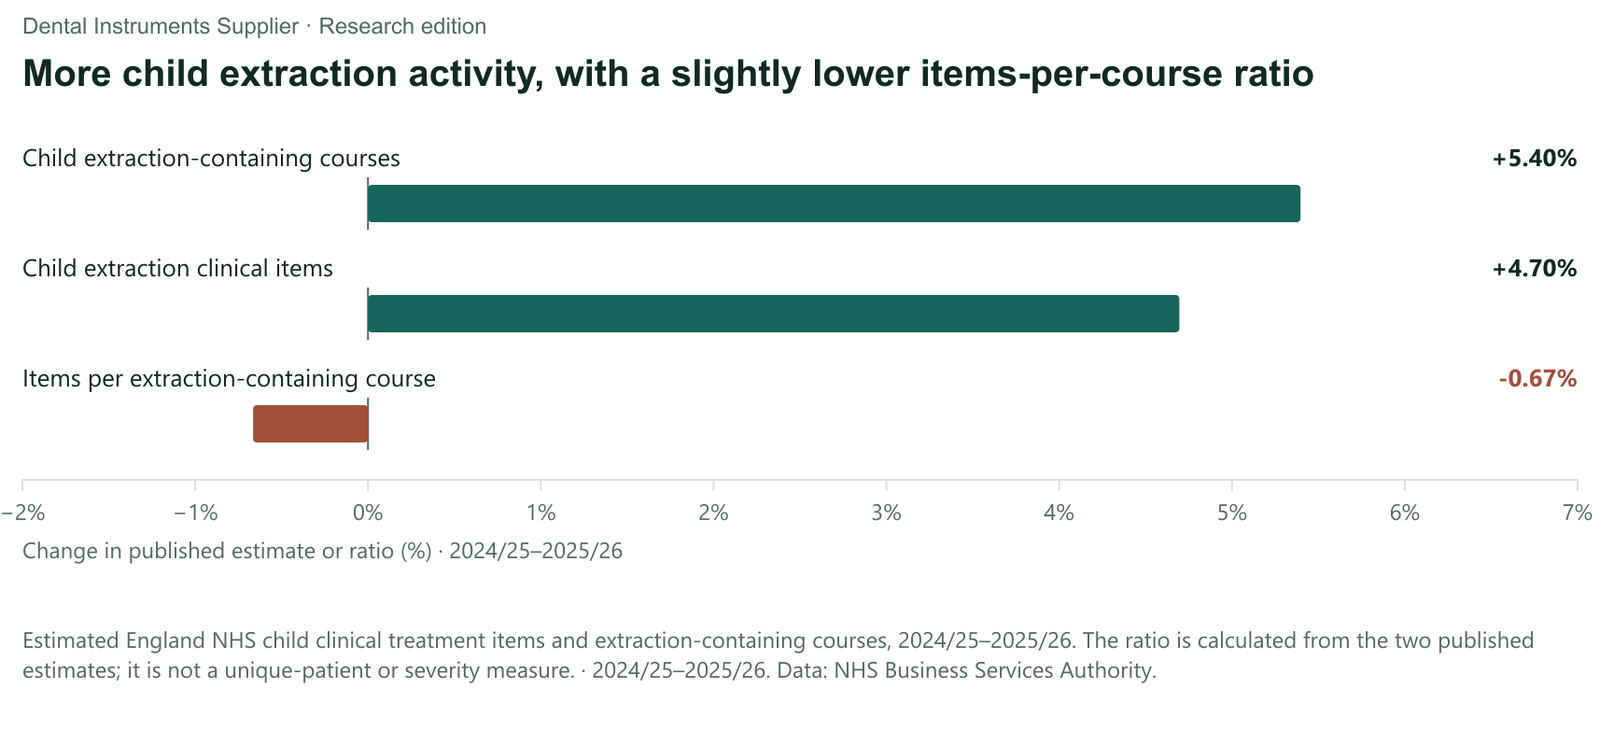
For children, a headline based on courses would report growth of 5.40%, while one based on items would report 4.70%. Both figures are correct, but they answer different questions. For adults, the gap runs the other way.
The ratio is an administrative measure. It does not show teeth extracted per patient, clinical severity or the reasons for extraction.
From the 2025/26 release, NHSBSA classifies adults and children by age at acceptance and restates earlier years on the same basis (NHSBSA background, section 3.1). For this reason, we take both years from the latest workbook. Adult and child figures from older releases should not be combined with these.
How do NHS-active dentist joiners and leavers reconcile with headcount?
| Year | NHS-active headcount | Joiners | Leavers | Net flow |
|---|---|---|---|---|
| 2024/25 | 24,655 | 2,213 | 1,865 | 348 |
| 2025/26 | 25,419 | 2,323 | 1,559 | 764 |
Source: NHSBSA workforce Table 1a · Latest-release corrected headcounts; performers in GDS/PDS/TDS. Flow is activity status, not profession entry/exit.
The headcount of NHS-active dentists rose from 24,655 in 2024/25 to 25,419 in 2025/26. That is an increase of 764, or 3.10%. The 2024/25 figure is the corrected value. NHSBSA restated it in March 2026 after including late-submitted performers (notice of correction).
The flows behind this change are:
- Joiners rose from 2,213 to 2,323.
- Leavers fell from 1,865 to 1,559.
- Net flow (joiners minus leavers) rose from 348 to 764, an increase of 416.
A larger net NHS-active dentist flow

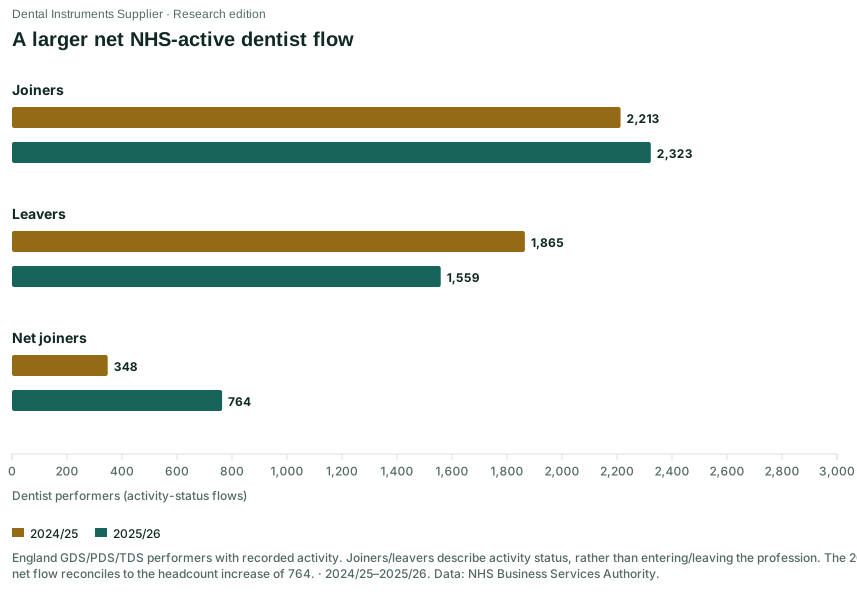
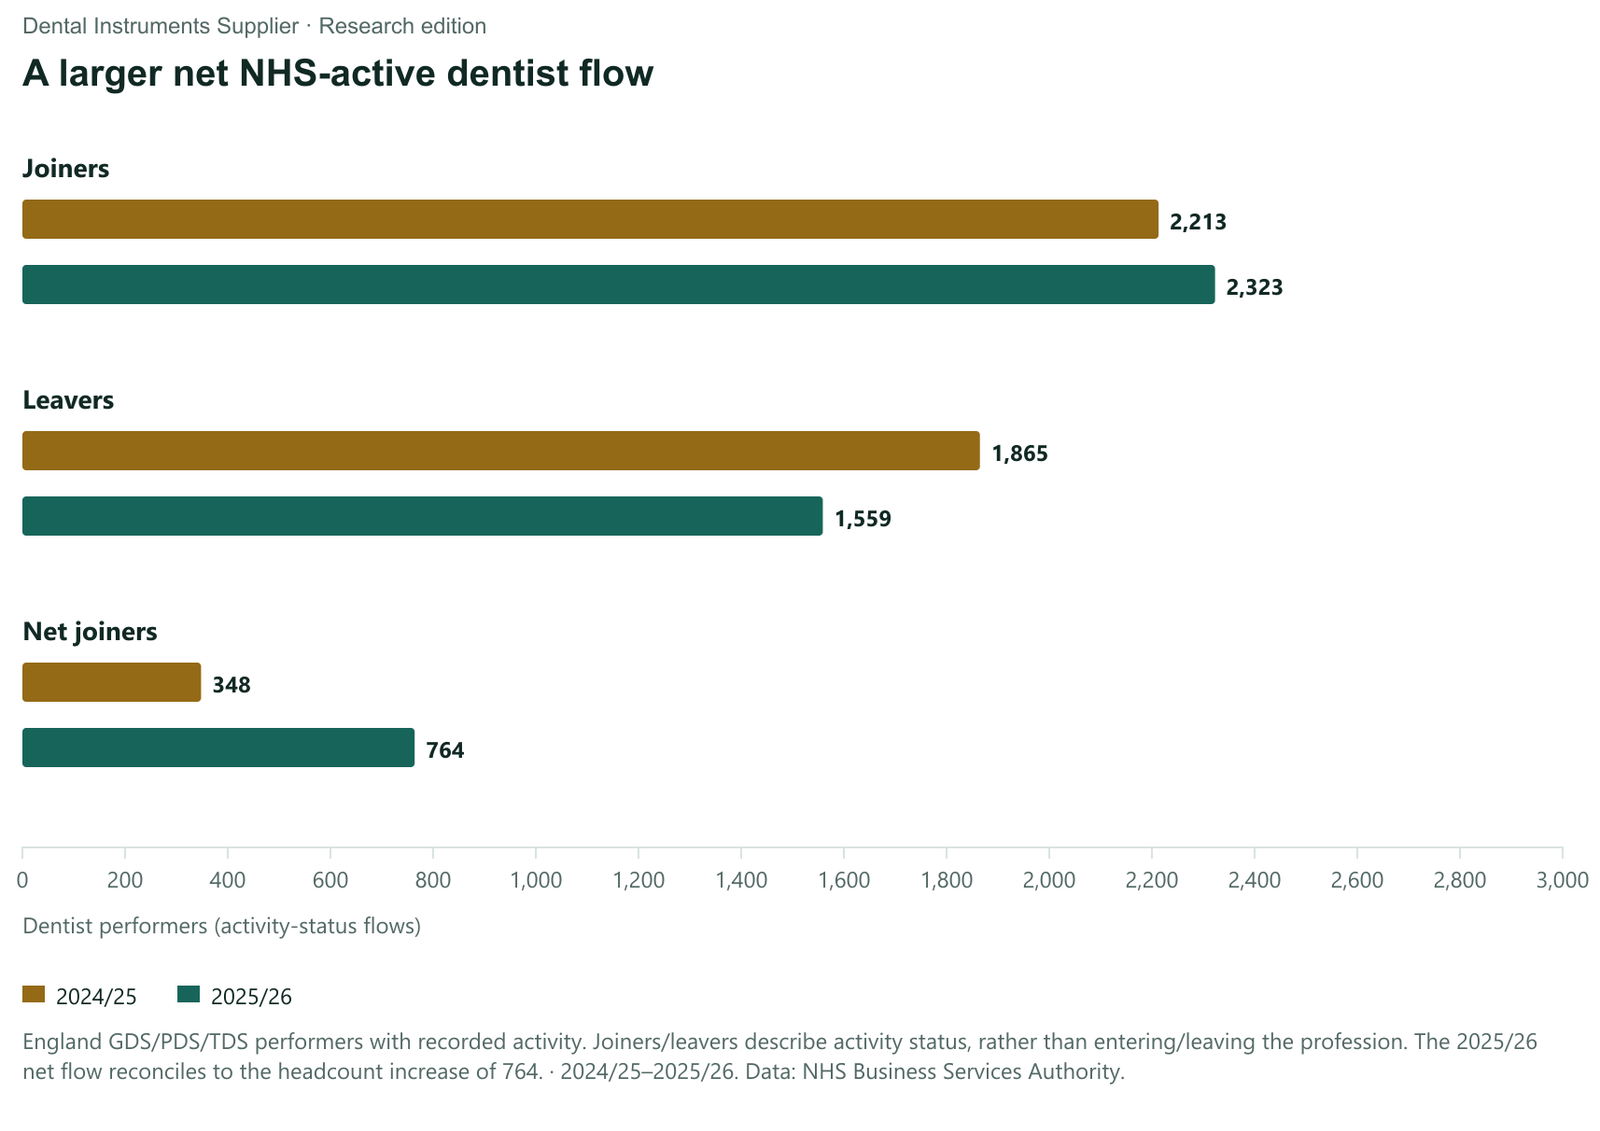
The 2025/26 net flow of 764 exactly matches the change in headcount. The same check works for the previous year. The workforce workbook (Table 1a) gives a 2023/24 headcount of 24,307. The 2024/25 headcount change was therefore 348 (24,655 minus 24,307), which equals 2024/25 joiners minus leavers (2,213 minus 1,865).
These matches are expected, because joiners and leavers are defined by comparing activity in consecutive years. They are consistency checks, not independent evidence. They confirm that the restated headcounts and the published flows fit together.
By our arithmetic, most of the larger net flow in 2025/26 came from fewer leavers (306 fewer) rather than more joiners (110 more).
A joiner is a dentist with NHS activity in the current year but none in the previous year. A leaver is a dentist with NHS activity in the previous year but none in the current year. A joiner may be returning after an inactive year rather than recording NHS activity for the first time. Neither term means entering or leaving the profession, retiring, graduating or migrating. Headcount is also not the same as full-time equivalent staff or hours worked.
Courses grew 6.23% while headcount grew 3.10%. These two figures cannot support a productivity comparison. Headcount is not a measure of capacity, and the workforce count includes orthodontic activity that the course totals exclude.
How this analysis relates to other coverage
Other published commentary uses different measures:
- The Royal College of Surgeons of England focused on patients-seen coverage and geographic variation.
- The British Dental Journal reported concerns about activity compared with pre-pandemic levels.
This analysis uses neither patients-seen figures nor comparisons with 2018/19. It compares adjacent years on the same restated basis.
Methods, definitions and corrections
Study type. This is an original descriptive secondary analysis of official administrative data. It is not an NHSBSA publication, a clinical study, a forecast or a causal evaluation. All derived figures (growth rates, shares, contributions, ratios and net flows) are our own calculations. The calculations were automated, and the research and drafting were AI-assisted. We make no claims of statistical significance.
Sources and versions. NHSBSA released the data on 27 August 2026. The release page was updated on 24 September 2026 and the narrative on 9 September 2026. We retrieved the files on 14 October 2026. We used the national activity and workforce XLSX workbooks, the background document and the CSV metadata. The 2023/24 headcount of 24,307 is taken from Table 1a of the workforce workbook.
Observation period. Activity figures count courses that ended between 1 April 2025 and 31 March 2026, compared with 2024/25. These are financial-year statistics, not calendar 2026 statistics. Annual activity and clinical data are final, but historical values can still be revised in later releases.
Coverage. The activity and clinical tables cover NHS general dental activity in England only. They exclude private, cosmetic and NHS hospital dental activity, and national course totals exclude orthodontics. The workforce headcounts and flows are national counts of NHS-active dentist performers in England, based on at least one UDA or UOA in the year. They therefore include performers with orthodontic activity. They are not counts of registered dentists or full-time equivalents. We excluded the separately bundled 2026/27 patient files, which cover April to June 2026 only, and the patients-seen measures.
Formulas.
- Growth = (current ÷ previous − 1) × 100
- Share = category courses ÷ all courses × 100
- Contribution = category change in courses ÷ total change in courses × 100. Negative contributions are kept.
- Items per course = estimated items ÷ estimated extraction-containing courses
- Net flow = joiners − leavers
Rounding. Every derived figure was calculated from unrounded published counts. Percentages and ratios are displayed to two decimal places, and counts are shown as published. A displayed change can therefore differ slightly from the difference between two displayed values. The urgent share change is one example: 0.21 points calculated, compared with 0.22 points from the rounded shares. The chart CSVs keep full precision.
Corrections. We took three NHSBSA correction notices into account:
- 27 March 2026: corrected the 2023/24 and 2024/25 workforce counts. We use the restated values.
- 9 September 2026: removed duplicate CSV rows that did not change grouped totals, and corrected narrative Table 7 and geographic Table 3d. We used XLSX cells rather than the affected CSV rows. The corrected narrative and geographic tables are not used here.
- 24 September 2026: corrected a geographic table that is not used here.
Frequently asked questions
Does a 6.23% rise in courses mean more people saw an NHS dentist?
Not necessarily. A course is a claim form, and one person can have more than one course in a year. Patient numbers come from the separate patients-seen statistics.
Why did urgent courses grow fast while their share barely changed?
Urgent-band courses make up about one-tenth of all courses. They grew 2.21 percentage points faster than the total, which moved their share by only 0.21 points.
Do Free courses cover all treatment for patients exempt from charges?
No. Free is one treatment category in the workbook. Patients exempt from charges also receive courses in other bands, so the Free count is not a measure of all exempt-patient care.
Can extraction items per course be read as teeth removed per patient?
No. The ratio compares two estimated administrative counts. It has no patient denominator and does not measure severity.
Do 764 more NHS-active dentists mean 764 more dentists in England?
No. The count includes only dentists who recorded NHS activity, measured in UDAs or UOAs, during the year. It does not count registered dentists, full-time equivalents or private-only practitioners.
Are these 2026 dental statistics?
They are 2025/26 financial-year statistics, released and analysed in 2026.
Check the data
Each chart above has a downloadable CSV. The calculation records list every input value, its source file, the formula used and the derived result. To check or reuse any figure, start with the original national activity workbook and workforce workbook, and read them alongside the NHSBSA correction notices.
Cite this analysis
Dental Instruments Supplier. NHS Dental Statistics for England 2025/26: Treatment and Workforce. Secondary analysis of NHSBSA national activity and workforce workbooks. Data retrieved 14 October 2026. Published 16 October 2026. https://dentalinstrumentssupplier.com/research/nhs-dental-statistics-england-2025-26.
Article, calculated tables, source-linked claim records and original chart images.
Calculation tables and source-linked claim records
- nhs band growth contribution
- nhs chart annual all and urgent
- nhs chart band growth contribution
- nhs chart band mix
- nhs chart extraction growth
- nhs chart extraction intensity
- nhs chart workforce flow decomposition
- nhs child extraction components
- nhs claim ledger
- nhs publication tables
- nhs urgent versus total
- nhs workforce flows