
Key findings
This study reports what official trade data record for two separate export categories from Pakistan. You can use it to check headline values, see which destinations dominate each category, and review the limits before you quote a figure. The two categories are reported separately throughout and are never added together.
- Medical, surgical and veterinary instruments (HS 901890): USD 446.50 million in calendar 2025. This was up 0.04% (USD 178,190) on 2024. Source: WITS, Pakistan exports, HS 901890, 2025.
- Other dental instruments and appliances (HS 901849): USD 1.86 million in 2025. This was up 67.36% from USD 1.11 million in 2024, an increase of USD 747,370. Source: WITS, Pakistan exports, HS 901849, 2025.
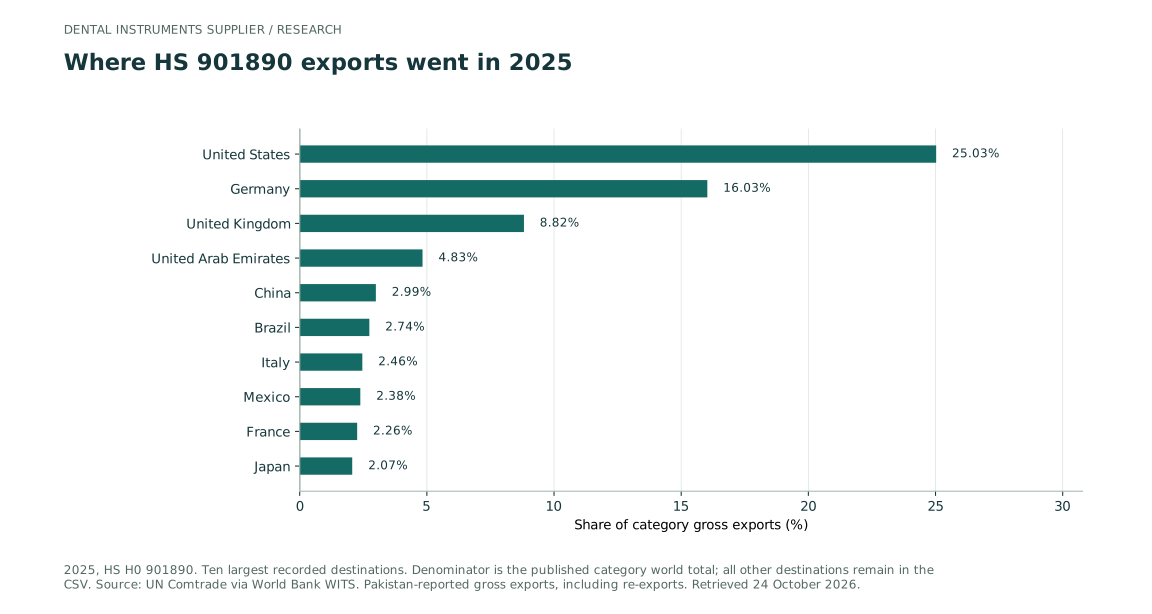
- Three destinations take about half of HS 901890. The United States (25.03%), Germany (16.03%) and the United Kingdom (8.82%) together accounted for 49.87% of 2025 value. The top five destinations accounted for 57.69%.
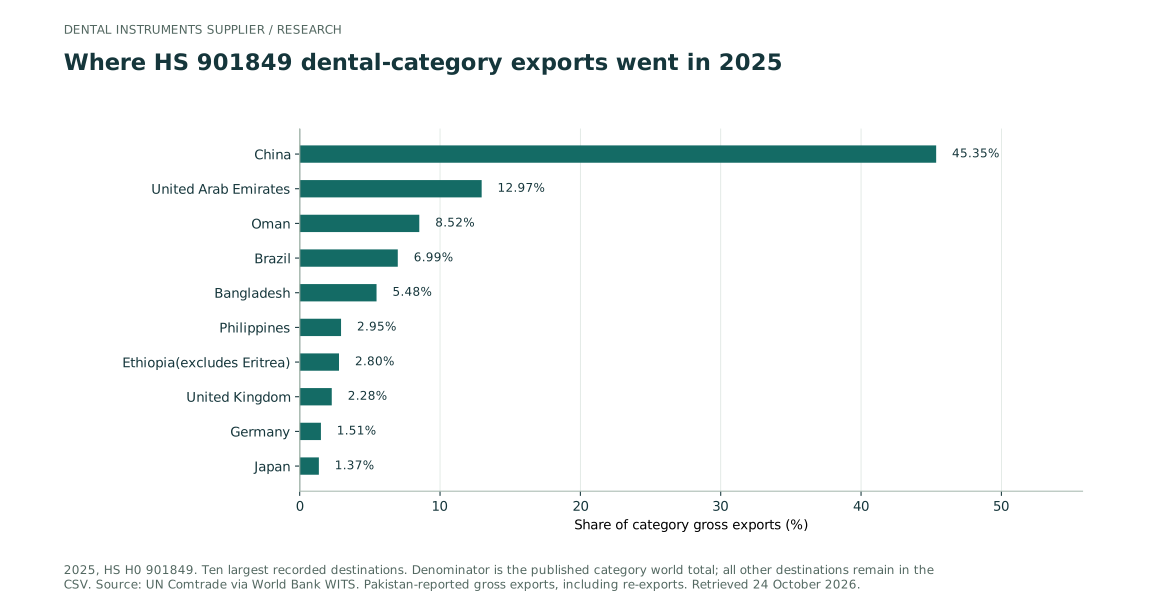
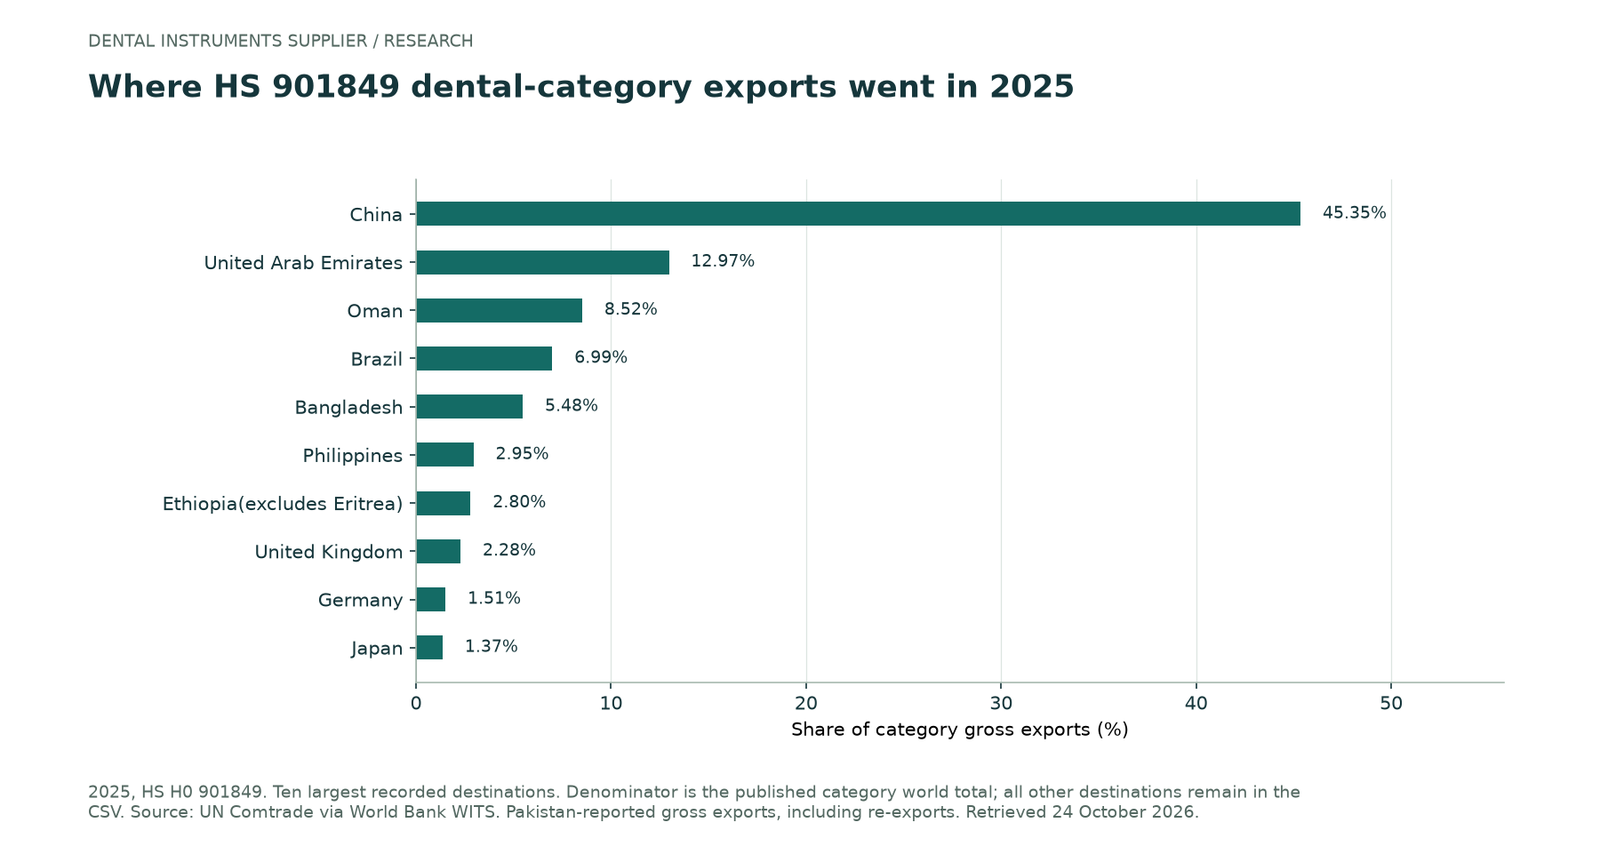
- HS 901849 is more concentrated. China alone took 45.35% of 2025 value. China, the United Arab Emirates and Oman together took 66.84%, and the top five destinations took 79.30%.
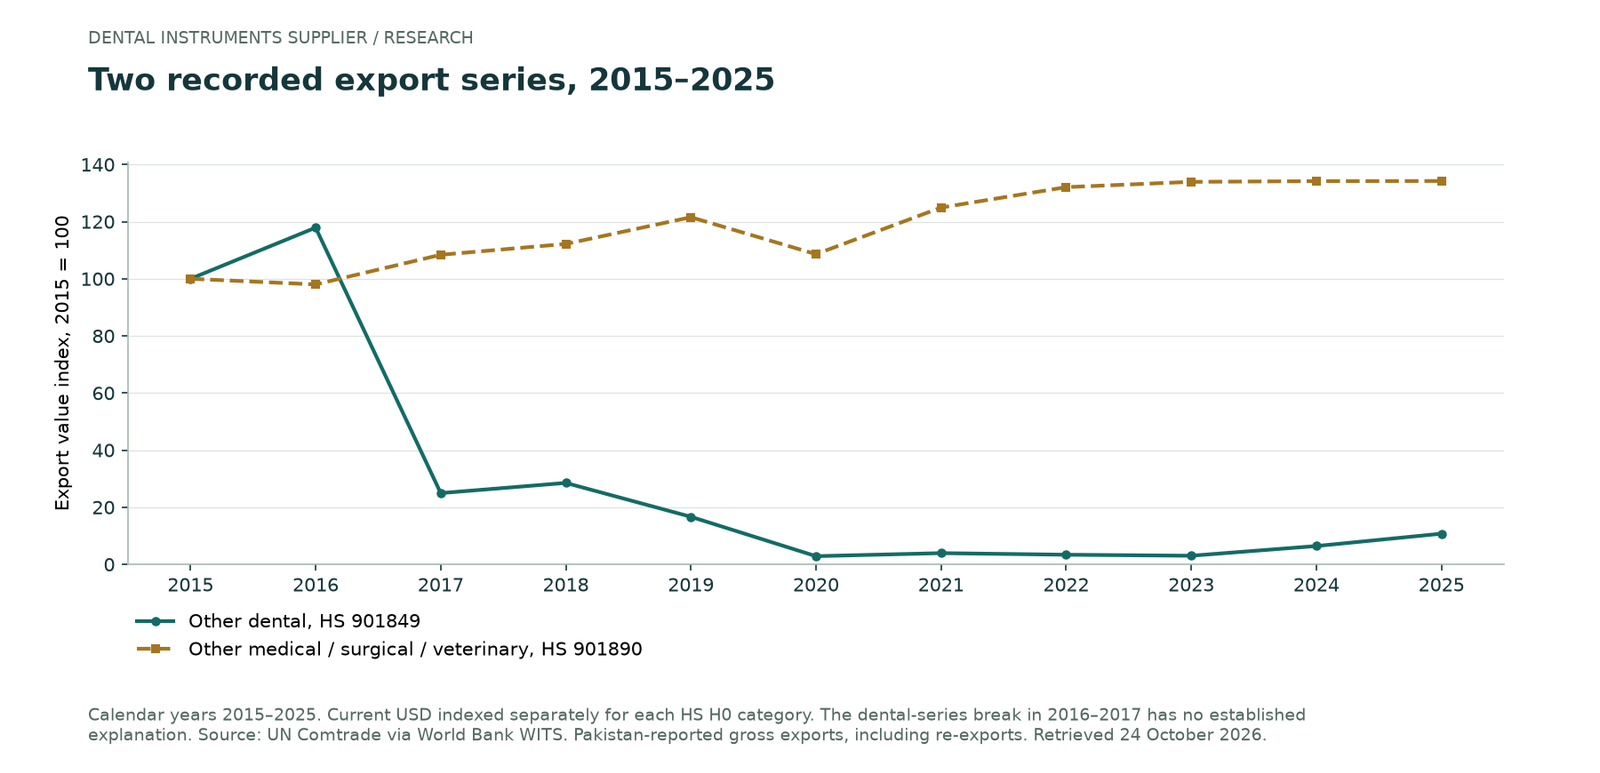
- Long-run record. HS 901890 rose 34.23% between 2015 and 2025, from USD 332.64 million. That is a compound annual growth rate of 2.99%. The recorded HS 901849 series fell sharply between 2016 and 2017. The cause has not been established, and this series is not a measure of the whole dental instrument industry.
- Latest Pakistan Bureau of Statistics (PBS) context. The PBS “surgical goods & medical instruments” group recorded USD 451.53 million in FY2025/26, against USD 451.67 million in FY2024/25 (−0.03%). It recorded USD 121.20 million in July–September 2026, against USD 111.40 million a year earlier (+8.8%). This is a separate series. It is not equivalent to either HS category.
Scope and definitions
The study covers exports reported by Pakistan. It analyses two six-digit Harmonized System (HS) subheadings side by side.
- HS 901849: other instruments and appliances used in dental sciences. This subheading excludes dental drill engines (HS 901841). It is therefore not a total for all dental products.
- HS 901890: other instruments and appliances used in medical, surgical or veterinary sciences. This is a broad residual category. It includes handheld surgical instruments, but it is wider than them. In Pakistan's national tariff detail, the category also contains stethoscopes, sphygmomanometers, infant incubators, fibre dialysers and anaesthesia apparatus. These sit alongside surgical scissors, surgical knives and a large line for other instruments.
Periods covered:
- Calendar years 2015–2025 for the World Bank World Integrated Trade Solution (WITS) series, which draws on UN Comtrade.
- PBS fiscal years (July–June) FY2023/24 and FY2024/25 for Pakistan Customs Tariff (PCT) product detail.
- FY2025/26 and July–September 2026 for the separate PBS selected-commodity group.
What the values measure. The values are customs export values. They are not company revenue, industry turnover or manufacturing profit.
Outside the scope of this study: global market size, Pakistan's world rank, regional or city shares, employment, firm counts, current capacity, product quality, clinical performance, prices, volumes, and import or mirror data.
Status of this study. This is a descriptive secondary analysis of official data by Dental Instruments Supplier, a commercial dental instrument business. It is not a government publication, a survey, a clinical study or a forecast.
Ten-year history, 2015–2025
HS 901890: medical, surgical and veterinary instruments
Recorded exports were USD 332.64 million in 2015 and USD 446.50 million in 2025. That is a rise of 34.23%, or a compound annual growth rate of 2.99%. On an index where 2015 equals 100, the 2025 value stands at 134.23.
The path was not smooth:
- Values dipped 1.99% in 2016.
- Values rose 10.60% in 2017 to USD 360.57 million.
- Values reached USD 404.32 million in 2019.
- Values fell 10.64% in 2020 to USD 361.30 million.
- Values rebounded 15.02% in 2021 to USD 415.57 million.
Growth then slowed each year:
- +5.72% in 2022
- +1.41% in 2023
- +0.18% in 2024
- +0.04% in 2025
On these figures, the category has been broadly flat in nominal terms for the last three years.
HS 901849: other dental instruments and appliances
The recorded series behaves very differently.
- 2015: USD 17.29 million.
- 2016: USD 20.38 million (+17.89%).
- 2017: USD 4.31 million (−78.84%).
- 2019: USD 2.88 million.
- 2020: USD 496,310.
- 2021–2023: between USD 522,560 and USD 680,010.
- 2024: USD 1,109,560 (+112.33%).
- 2025: USD 1,856,930 (+67.36%).
Over the full period, recorded values fell 89.26%, a compound annual rate of −20.00%. On a 2015 = 100 basis, the 2025 index is 10.74.
How to read this. These figures describe what was recorded under this specific customs code. They do not measure the output of Pakistan's dental instrument makers, and this study has not established why the 2016–2017 change occurred. The decline should not be presented as an industry collapse.
Two recorded export series, 2015–2025


| Calendar year | HS 901849 (USD million) | HS 901890 (USD million) |
|---|---|---|
| 2015 | 17.28628 | 332.64194 |
| 2016 | 20.37961 | 326.02848 |
| 2017 | 4.31290 | 360.57467 |
| 2018 | 4.92934 | 373.18161 |
| 2019 | 2.87991 | 404.31765 |
| 2020 | 0.49631 | 361.29784 |
| 2021 | 0.68001 | 415.57439 |
| 2022 | 0.58299 | 439.33804 |
| 2023 | 0.52256 | 445.52108 |
| 2024 | 1.10956 | 446.32362 |
| 2025 | 1.85693 | 446.50181 |
Destination markets in 2025
Each share below is the destination's 2025 value divided by Pakistan's published world total for that code. Partner labels are reproduced as the source shows them. They are not a count of sovereign countries.
Where a partner has no row for 2024, the 2024 value is left missing. It is never treated as zero.
HS 901890: ten largest destinations
- United States: USD 111.74m (25.03%); +2.54% on 2024
- Germany: USD 71.56m (16.03%); +4.63%
- United Kingdom: USD 39.37m (8.82%); +0.24%
- United Arab Emirates: USD 21.56m (4.83%); −9.45%
- China: USD 13.37m (2.99%); −11.37%
- Brazil: USD 12.23m (2.74%); −6.13%
- Italy: USD 10.99m (2.46%); +14.85%
- Mexico: USD 10.64m (2.38%); −3.86%
- France: USD 10.09m (2.26%); −9.26%
- Japan: USD 9.22m (2.07%); −7.43%
The top three destinations held 49.87% of 2025 value, and the top five held 57.69%.
HS 901849: ten largest destinations
- China: USD 842,160 (45.35%); up from USD 543,520
- United Arab Emirates: USD 240,770 (12.97%); up from USD 141,650
- Oman: USD 158,240 (8.52%); no 2024 row reported
- Brazil: USD 129,780 (6.99%); up from USD 73,920
- Bangladesh: USD 101,680 (5.48%); up from USD 75,670
- Philippines: USD 54,710 (2.95%); no 2024 row reported
- Ethiopia (excludes Eritrea): USD 52,000 (2.80%); no 2024 row reported
- United Kingdom: USD 42,420 (2.28%); up from USD 27,310
- Germany: USD 28,090 (1.51%); up from USD 5,470
- Japan: USD 25,360 (1.37%); no 2024 row reported
The top three destinations held 66.84% of 2025 value, and the top five held 79.30%.
Why the two lists differ. The leading destinations differ markedly between the codes. North America and Western Europe lead HS 901890. China and Gulf partners lead HS 901849. Because HS 901849 values are small, a single destination's change can move the total substantially.
Where HS 901890 exports went in 2025

Where HS 901849 dental-category exports went in 2025

Explore all destination rows for HS 901890
| Destination | 2024 current USD | 2025 current USD | Change (%) |
|---|---|---|---|
| United States | 108,972,450.00 | 111,737,540.00 | 2.54 |
| Germany | 68,396,270.00 | 71,563,560.00 | 4.63 |
| United Kingdom | 39,274,470.00 | 39,368,390.00 | 0.24 |
| United Arab Emirates | 23,812,660.00 | 21,563,480.00 | -9.45 |
| China | 15,087,010.00 | 13,372,000.00 | -11.37 |
| Brazil | 13,024,830.00 | 12,226,070.00 | -6.13 |
| Italy | 9,573,040.00 | 10,994,690.00 | 14.85 |
| Mexico | 11,067,900.00 | 10,640,570.00 | -3.86 |
| France | 11,117,910.00 | 10,088,300.00 | -9.26 |
| Japan | 9,961,700.00 | 9,221,580.00 | -7.43 |
| Netherlands | 7,620,590.00 | 7,778,250.00 | 2.07 |
| Australia | 9,269,640.00 | 7,732,320.00 | -16.58 |
| Turkey | 6,940,480.00 | 7,085,470.00 | 2.09 |
| Poland | 5,500,140.00 | 5,716,600.00 | 3.94 |
| Russian Federation | 7,651,340.00 | 5,502,560.00 | -28.08 |
| Korea, Rep. | 5,625,310.00 | 5,491,100.00 | -2.39 |
| Belgium | 5,481,960.00 | 5,199,810.00 | -5.15 |
| Czech Republic | 3,767,240.00 | 3,851,600.00 | 2.24 |
| Switzerland | 3,794,150.00 | 3,822,600.00 | 0.75 |
| Denmark | 3,528,630.00 | 3,341,760.00 | -5.30 |
| Canada | 3,028,500.00 | 3,188,690.00 | 5.29 |
| Philippines | 3,421,630.00 | 3,087,160.00 | -9.78 |
| Saudi Arabia | 3,345,460.00 | 2,973,730.00 | -11.11 |
| Vietnam | 2,951,560.00 | 2,909,760.00 | -1.42 |
| Chile | 2,626,280.00 | 2,826,360.00 | 7.62 |
| Algeria | 1,514,470.00 | 2,683,540.00 | 77.19 |
| Spain | 2,730,920.00 | 2,611,760.00 | -4.36 |
| Portugal | 1,796,270.00 | 2,579,210.00 | 43.59 |
| Indonesia | 2,687,160.00 | 2,505,370.00 | -6.77 |
| Thailand | 2,726,200.00 | 2,480,860.00 | -9.00 |
| Morocco | 2,243,270.00 | 2,417,140.00 | 7.75 |
| Malaysia | 2,370,780.00 | 2,305,030.00 | -2.77 |
| Singapore | 2,570,020.00 | 2,243,520.00 | -12.70 |
| South Africa | 2,327,910.00 | 2,240,030.00 | -3.78 |
| Egypt, Arab Rep. | 2,243,710.00 | 2,164,220.00 | -3.54 |
| Argentina | 1,750,540.00 | 2,009,740.00 | 14.81 |
| Tanzania | 1,775,280.00 | 1,963,590.00 | 10.61 |
| Hungary | 1,700,260.00 | 1,838,210.00 | 8.11 |
| New Zealand | 1,565,530.00 | 1,696,530.00 | 8.37 |
| Peru | 1,727,810.00 | 1,632,340.00 | -5.53 |
| Other Asia, nes | 1,555,290.00 | 1,626,360.00 | 4.57 |
| Colombia | 1,531,560.00 | 1,545,300.00 | 0.90 |
| Nigeria | 893,830.00 | 1,452,220.00 | 62.47 |
| Bulgaria | 1,150,140.00 | 1,375,540.00 | 19.60 |
| Slovak Republic | 1,226,990.00 | 1,339,770.00 | 9.19 |
| Oman | 1,262,480.00 | 1,165,810.00 | -7.66 |
| Austria | 766,080.00 | 1,047,740.00 | 36.77 |
| Romania | 1,059,830.00 | 976,490.00 | -7.86 |
| Ireland | 1,071,830.00 | 953,030.00 | -11.08 |
| Bangladesh | 745,290.00 | 920,310.00 | 23.48 |
| Nepal | 736,370.00 | 895,860.00 | 21.66 |
| Guatemala | 708,090.00 | 766,970.00 | 8.32 |
| Sweden | 711,150.00 | 761,050.00 | 7.02 |
| Uganda | 464,710.00 | 755,560.00 | 62.59 |
| Kenya | 861,590.00 | 735,870.00 | -14.59 |
| Uruguay | 778,000.00 | 715,420.00 | -8.04 |
| Ecuador | 642,290.00 | 693,490.00 | 7.97 |
| Kazakhstan | 867,320.00 | 680,070.00 | -21.59 |
| Hong Kong, China | 810,450.00 | 588,840.00 | -27.34 |
| Ethiopia(excludes Eritrea) | 438,240.00 | 567,180.00 | 29.42 |
| Greece | 555,060.00 | 530,110.00 | -4.50 |
| Ukraine | 498,480.00 | 507,140.00 | 1.74 |
| Dominican Republic | 413,710.00 | 487,460.00 | 17.83 |
| Jordan | 336,500.00 | 467,140.00 | 38.82 |
| Madagascar | 73,260.00 | 447,450.00 | 510.77 |
| Albania | 408,910.00 | 425,770.00 | 4.12 |
| Yemen | 281,120.00 | 415,390.00 | 47.76 |
| Lithuania | 120,480.00 | 375,890.00 | 211.99 |
| Paraguay | 239,690.00 | 366,710.00 | 52.99 |
| Ghana | 203,880.00 | 365,230.00 | 79.14 |
| Tunisia | 259,740.00 | 285,740.00 | 10.01 |
| Rwanda | 207,630.00 | 265,100.00 | 27.68 |
| Mozambique | 240,770.00 | 263,030.00 | 9.25 |
| Panama | 129,230.00 | 258,550.00 | 100.07 |
| Cote d'Ivoire | 242,580.00 | 244,150.00 | 0.65 |
| Zimbabwe | 175,790.00 | 243,260.00 | 38.38 |
| Uzbekistan | 54,340.00 | 237,720.00 | 337.47 |
| Burkina Faso | 84,470.00 | 235,270.00 | 178.52 |
| Iraq | 311,350.00 | 234,690.00 | -24.62 |
| Azerbaijan | 263,240.00 | 232,810.00 | -11.56 |
| Congo, Dem. Rep. | 202,370.00 | 223,300.00 | 10.34 |
| Costa Rica | 159,960.00 | 217,690.00 | 36.09 |
| Serbia, FR(Serbia/Montenegro) | 335,670.00 | 214,970.00 | -35.96 |
| Senegal | 148,240.00 | 206,320.00 | 39.18 |
| Djibouti | 277,600.00 | 199,650.00 | -28.08 |
| Sri Lanka | 676,610.00 | 194,660.00 | -71.23 |
| Kyrgyz Republic | 78,390.00 | 190,760.00 | 143.35 |
| Lebanon | 364,580.00 | 190,630.00 | -47.71 |
| Georgia | 168,270.00 | 184,030.00 | 9.37 |
| Mali | Not reported | 171,930.00 | Not reported |
| Zambia | 172,470.00 | 154,190.00 | -10.60 |
| El Salvador | 199,770.00 | 152,580.00 | -23.62 |
| Armenia | 73,570.00 | 147,690.00 | 100.75 |
| Luxembourg | 67,890.00 | 146,980.00 | 116.50 |
| Belarus | 253,140.00 | 145,520.00 | -42.51 |
| Qatar | 137,180.00 | 143,910.00 | 4.91 |
| Unspecified | 37,640.00 | 142,470.00 | 278.51 |
| Bolivia | 334,260.00 | 142,240.00 | -57.45 |
| Norway | 159,800.00 | 136,900.00 | -14.33 |
| Moldova | 141,640.00 | 134,650.00 | -4.94 |
| Somalia | 93,700.00 | 128,260.00 | 36.88 |
| Honduras | 198,720.00 | 113,670.00 | -42.80 |
| Guinea | 38,490.00 | 111,540.00 | 189.79 |
| Cyprus | 107,890.00 | 95,220.00 | -11.74 |
| Venezuela | 50,370.00 | 94,680.00 | 87.97 |
| Croatia | 94,620.00 | 83,640.00 | -11.60 |
| Libya | 126,610.00 | 77,290.00 | -38.95 |
| Angola | 83,430.00 | 70,580.00 | -15.40 |
| Mauritania | 130,930.00 | 69,190.00 | -47.15 |
| Guyana | 18,030.00 | 67,840.00 | 276.26 |
| Kuwait | 68,680.00 | 65,910.00 | -4.03 |
| Congo, Rep. | Not reported | 64,980.00 | Not reported |
| Cambodia | 52,310.00 | 58,600.00 | 12.02 |
| Malawi | 101,990.00 | 57,640.00 | -43.48 |
| Benin | 54,480.00 | 50,450.00 | -7.40 |
| Mauritius | 107,200.00 | 49,340.00 | -53.97 |
| Finland | 136,670.00 | 44,710.00 | -67.29 |
| Namibia | 25,840.00 | 42,550.00 | 64.67 |
| Papua New Guinea | 40,810.00 | 41,880.00 | 2.62 |
| Burundi | 49,580.00 | 41,740.00 | -15.81 |
| Nicaragua | 18,980.00 | 39,270.00 | 106.90 |
| Botswana | 23,160.00 | 36,160.00 | 56.13 |
| Jamaica | 23,410.00 | 35,980.00 | 53.70 |
| Slovenia | 55,520.00 | 35,000.00 | -36.96 |
| Malta | 31,550.00 | 32,950.00 | 4.44 |
| Sierra Leone | 9,520.00 | 29,900.00 | 214.08 |
| Sudan | 30,080.00 | 28,580.00 | -4.99 |
| Niger | 14,150.00 | 25,280.00 | 78.66 |
| Dominica | 1,510.00 | 24,340.00 | 1,511.92 |
| Togo | 62,490.00 | 24,220.00 | -61.24 |
| Tajikistan | 29,910.00 | 20,240.00 | -32.33 |
| Turkmenistan | 10,190.00 | 18,140.00 | 78.02 |
| Cameroon | 28,120.00 | 16,610.00 | -40.93 |
| Estonia | 87,890.00 | 15,920.00 | -81.89 |
| Lao PDR | 22,090.00 | 15,790.00 | -28.52 |
| Bahrain | 43,990.00 | 13,720.00 | -68.81 |
| Mongolia | 9,280.00 | 12,570.00 | 35.45 |
| Latvia | 142,410.00 | 12,390.00 | -91.30 |
| Trinidad and Tobago | 11,140.00 | 11,900.00 | 6.82 |
| Marshall Islands | Not reported | 10,920.00 | Not reported |
| Afghanistan | Not reported | 10,030.00 | Not reported |
| Bosnia and Herzegovina | 9,220.00 | 9,240.00 | 0.22 |
| Liberia | Not reported | 8,250.00 | Not reported |
| East Timor | Not reported | 7,530.00 | Not reported |
| Iceland | 3,710.00 | 6,870.00 | 85.18 |
| Brunei | 630.00 | 5,980.00 | 849.21 |
| Maldives | 19,860.00 | 5,960.00 | -69.99 |
| Comoros | 15,850.00 | 5,730.00 | -63.85 |
| Cayman Islands | Not reported | 2,400.00 | Not reported |
| Eswatini | 2,250.00 | 2,150.00 | -4.44 |
| United States Minor Outlying I | Not reported | 490.00 | Not reported |
| Belize | 22,490.00 | Not reported | Not reported |
| Chad | 19,680.00 | Not reported | Not reported |
| Fiji | 19,700.00 | Not reported | Not reported |
| Gabon | 6,690.00 | Not reported | Not reported |
| Haiti | 7,440.00 | Not reported | Not reported |
| Macao | 6,930.00 | Not reported | Not reported |
| Myanmar | 9,110.00 | Not reported | Not reported |
| St. Lucia | 2,250.00 | Not reported | Not reported |
Explore all destination rows for HS 901849
| Destination | 2024 current USD | 2025 current USD | Change (%) |
|---|---|---|---|
| China | 543,520.00 | 842,160.00 | 54.95 |
| United Arab Emirates | 141,650.00 | 240,770.00 | 69.98 |
| Oman | Not reported | 158,240.00 | Not reported |
| Brazil | 73,920.00 | 129,780.00 | 75.57 |
| Bangladesh | 75,670.00 | 101,680.00 | 34.37 |
| Philippines | Not reported | 54,710.00 | Not reported |
| Ethiopia(excludes Eritrea) | Not reported | 52,000.00 | Not reported |
| United Kingdom | 27,310.00 | 42,420.00 | 55.33 |
| Germany | 5,470.00 | 28,090.00 | 413.53 |
| Japan | Not reported | 25,360.00 | Not reported |
| United States | 64,730.00 | 18,750.00 | -71.03 |
| Thailand | Not reported | 15,650.00 | Not reported |
| Paraguay | Not reported | 14,680.00 | Not reported |
| Other Asia, nes | 13,320.00 | 13,850.00 | 3.98 |
| Costa Rica | 12,430.00 | 13,030.00 | 4.83 |
| Tanzania | Not reported | 12,810.00 | Not reported |
| Albania | Not reported | 10,990.00 | Not reported |
| Turkey | 53,000.00 | 10,830.00 | -79.57 |
| Poland | 29,240.00 | 10,570.00 | -63.85 |
| Korea, Rep. | 7,870.00 | 8,960.00 | 13.85 |
| Guatemala | 5,170.00 | 7,190.00 | 39.07 |
| Malaysia | 1,840.00 | 6,280.00 | 241.30 |
| Romania | 7,010.00 | 5,280.00 | -24.68 |
| Hong Kong, China | 5,530.00 | 5,050.00 | -8.68 |
| Canada | 1,140.00 | 4,710.00 | 313.16 |
| Austria | Not reported | 3,770.00 | Not reported |
| Indonesia | 2,100.00 | 3,550.00 | 69.05 |
| Belgium | Not reported | 2,950.00 | Not reported |
| Sweden | 2,190.00 | 2,740.00 | 25.11 |
| Lithuania | 2,910.00 | 2,640.00 | -9.28 |
| Unspecified | Not reported | 2,430.00 | Not reported |
| Peru | Not reported | 2,370.00 | Not reported |
| France | Not reported | 1,500.00 | Not reported |
| Serbia, FR(Serbia/Montenegro) | Not reported | 580.00 | Not reported |
| Australia | 1,540.00 | 550.00 | -64.29 |
| Colombia | 12,010.00 | Not reported | Not reported |
| Ghana | 970.00 | Not reported | Not reported |
| Italy | 410.00 | Not reported | Not reported |
| Kazakhstan | 990.00 | Not reported | Not reported |
| Lebanon | 12,090.00 | Not reported | Not reported |
| Morocco | 2,370.00 | Not reported | Not reported |
| Netherlands | 150.00 | Not reported | Not reported |
| Singapore | 1,400.00 | Not reported | Not reported |
| Slovak Republic | 380.00 | Not reported | Not reported |
| Spain | 820.00 | Not reported | Not reported |
| Switzerland | 200.00 | Not reported | Not reported |
| Venezuela | 210.00 | Not reported | Not reported |
What drove the 2024–2025 change
The contribution analysis is built in three steps:
- It lists the five largest positive and five largest negative changes among named destinations reported in both years.
- It adds a residual line. The residual covers all other destinations, partners reported in only one year, unspecified partners, and published rounding.
- Together, the eleven lines sum to the published change in the world total.
World rows and source labels are not double-counted.
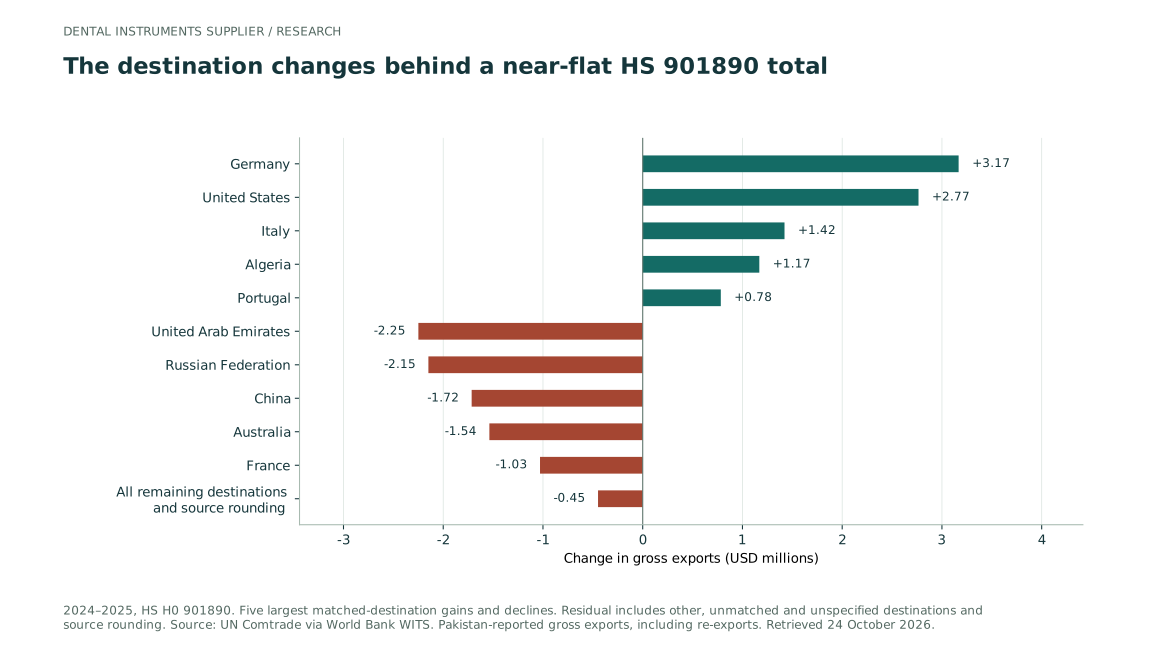
HS 901890: total change +USD 178,190
Largest positive changes:
- Germany +USD 3,167,290
- United States +USD 2,765,090
- Italy +USD 1,421,650
- Algeria +USD 1,169,070
- Portugal +USD 782,940
Largest negative changes:
- United Arab Emirates −USD 2,249,180
- Russian Federation −USD 2,148,780
- China −USD 1,715,010
- Australia −USD 1,537,320
- France −USD 1,029,610
All remaining destinations and rounding: −USD 447,950.
The near-zero total therefore hides sizeable gains and losses that largely offset each other.
HS 901849: total change +USD 747,370
Largest positive changes:
- China +USD 298,640
- United Arab Emirates +USD 99,120
- Brazil +USD 55,860
- Bangladesh +USD 26,010
- Germany +USD 22,620
Largest negative changes:
- United States −USD 45,980 (from USD 64,730 to USD 18,750)
- Turkey −USD 42,170
- Poland −USD 18,670
- Romania −USD 1,730
- Australia −USD 990
All remaining destinations and rounding: +USD 354,660.
The residual is large here because several 2025 destinations, such as Oman, have no 2024 row. They therefore cannot be matched as named year-on-year changes.
The destination changes behind a near-flat HS 901890 total

Pakistan tariff-line detail (PBS, FY2023/24–FY2024/25)
PBS publishes exports at the eight-digit Pakistan Customs Tariff (PCT) level. Values are in nominal Pakistani rupees (PKR thousand) for fiscal years running July to June.
These figures have not been converted to US dollars. A single exchange rate would misstate them, and they are not directly comparable with the calendar-year WITS series.
“Destination rows” means the number of destination rows with a positive value in FY2024/25. It is not a count of countries.
Dental lines (within HS 9018.4)
- 90184900, other dental instruments and appliances: PKR 418,980.964 thousand, against PKR 195,138.127 thousand (+114.71%). 28 destination rows.
- 90184100, dental drill engines: PKR 2,290.222 thousand, against PKR 1,024.582 thousand (+123.53%). 4 destination rows.
Selected lines within HS 901890
- 90189090, other medical, surgical and veterinary instruments: PKR 125,347,166.163 thousand, against PKR 125,131,310.033 thousand (+0.17%). 157 destination rows.
- 90189030, surgical scissors: PKR 153,014.811 thousand, against PKR 183,475.237 thousand (−16.60%). 22 destination rows.
- 90189040, surgical knives: PKR 21,836.489 thousand, against PKR 89.248 thousand. The percentage change is very large because the base was very small.
- 90189070, fibre dialysers: PKR 3,014.836 thousand (+79.84%).
- 90189020, stethoscopes: PKR 557.872 thousand (−2.32%).
Other HS 9018 lines
- 90185000, ophthalmic instruments: PKR 75,050.207 thousand (+69.78%).
- 90183990, other needles, catheters and cannulae: PKR 66,596.153 thousand (+7.29%).
Several small lines moved from zero, or to zero, between years. Large percentage swings on small bases should be treated with caution. Source quantities (unit “NO”) are shown in the PBS file but are not analysed here.
| PCT code | Source description | FY2023/24 (PKR thousand) | FY2024/25 (PKR thousand) | Nominal PKR change (%) |
|---|---|---|---|---|
| 90184100 | DENTAL DRILL ENGINES,W/C-D-EQU | 1,024.582 | 2,290.222 | 123.53 |
| 90184900 | OTH;INS/APPLI, DENTAL SCIENCE | 195,138.127 | 418,980.964 | 114.71 |
| 90189020 | STETHOSCOPES | 571.110 | 557.872 | -2.32 |
| 90189030 | SURGICAL SCISSORS | 183,475.237 | 153,014.811 | -16.60 |
| 90189040 | SURGICAL KNIVES | 89.248 | 21,836.489 | 24,367.20 |
| 90189070 | FIBRE DIALIZERS | 1,676.400 | 3,014.836 | 79.84 |
| 90189090 | OTH INST,APP MEDICAL/SUR/VETEN | 125,131,310.033 | 125,347,166.163 | 0.17 |
Latest available period: PBS selected group
PBS monthly export releases report a selected-commodity group labelled “surgical goods & medical instruments”, in nominal USD thousand.
- FY2025/26 (July 2025–June 2026): USD 451.53 million, against USD 451.67 million in FY2024/25 (−0.03%). Source: PBS Export June 2026, Sheet1 F176 and I176.
- July–September 2026: USD 121.20 million, against USD 111.40 million in July–September 2025 (+8.8%). Source: PBS Export September 2026, Sheet1 F176 and I176.
Limits of this series:
- The quarterly comparison covers matching quarters only and is not annualised.
- This study did not obtain the exact mapping of the PBS group to PCT lines.
- The group is therefore not equated with HS 9018, HS 901849 or HS 901890, and it is not added to them.
- Current-year PBS files may be revised.
| Period | Comparison type | Export value (USD million) |
|---|---|---|
| FY2024/25 | completed fiscal year | 451.668 |
| FY2025/26 | completed fiscal year | 451.527 |
| July-September2025 | matching fiscal first quarter | 111.403 |
| July-September2026 | matching fiscal first quarter | 121.203 |
How to use these figures
What the data support
- Quoting recorded values. You can quote Pakistan-reported export values for each HS code and year, with the source and code stated.
- Comparing destinations. You can identify which destinations recorded the largest values within one code in 2025, and how concentrated each code is.
- Separating a flat total from its parts. You can show that the near-flat 2025 total for HS 901890 combined offsetting gains and losses across destinations.
- Using the dental codes accurately. You can show that Pakistan's tariff detail recorded higher nominal rupee values for both dental PCT lines in FY2024/25 than in FY2023/24.
What the data do not support
- Claims about the total size of Pakistan's dental or surgical instrument industry. They also do not support claims about its share of a global market or its world rank.
- Explanations for the 2016–2017 change in HS 901849, or any claim that the dental industry collapsed.
- Conclusions about prices, volumes, quality, clinical outcomes, profit margins or employment.
- Inferences about intermediary or re-export margins. Import or mirror data are not used here, and differences between export and import records cannot prove such margins.
- Real-terms growth. No inflation adjustment has been made.
Methods and limitations
- WITS series. WITS publishes Pakistan-reported export values in USD thousand. These were multiplied by 1,000 to give current US dollars.
- Classification and coverage. The series uses one consistent nomenclature (HS 1988/92, H0) for 2015–2025. It records gross exports, including re-exports.
- Calculations.
- Year-on-year change: (current ÷ previous − 1) × 100.
- Compound annual growth rate: calculated over the ten intervals from 2015 to 2025.
- Index: 2015 = 100.
- Destination shares. Each share uses the published world total as its denominator. Two unspecified partner labels in WITS are aggregated only for the named-destination comparison. Raw rows and identifiers are preserved in the downloads.
- Missing data. Partner-year rows that are absent from the source remain missing. They are not imputed as zero.
- Contribution chart. Covered in the contribution analysis section. A residual line ensures the components sum to the published world change.
- PBS PCT detail. This detail is kept in nominal PKR thousand and is not converted. The PBS selected group is kept separate as context.
- No statistical modelling. No hypothesis testing, seasonal adjustment, inflation adjustment or forecasting has been applied.
- Quantities. Quantities on source pages may be estimated, so they are retained but not analysed.
- Revisions. Official data may be revised after publication. All sources were retrieved on 24 October 2026, and figures reflect that date.
- Rounding. Rounded figures in the text may not sum exactly. The downloadable tables carry source values at the precision each source displays; original inputs remain rounded as published. Calculated values are retained without additional display rounding. Observation identifiers are held in the source-observation CSV and the claim ledger.
Sources
All sources below were retrieved on 24 October 2026. The downloadable source manifest lists query URLs, hashes and retrieval times. Observation identifiers are recorded in the source-observation CSV and the claim ledger.
WITS / UN Comtrade (calendar years, USD)
- Pakistan exports, HS 901890, 2025
- Pakistan exports, HS 901890, 2024
- Pakistan exports, HS 901890, 2015
- Pakistan exports, HS 901849, 2025
- Pakistan exports, HS 901849, 2024
- Pakistan exports, HS 901849, 2015
- Pages for 2016–2023 follow the same address pattern, with the year changed. All query URLs are listed in the manifest.
- WITS methodology notes
- UN Comtrade data explorer: about and reuse
Pakistan Bureau of Statistics
- External trade statistics catalogue
- D-10 PCT export detail, FY2024/25
- Export release, June 2026
- Export release, September 2026
- External trade methodology documents
Federal Board of Revenue (code definitions)
Background and related study
- SMEDA sector brief: Surgical Instruments (2022). Background only; no figures in this study are drawn from it.
- Dental Instruments Supplier: Dental Instrument Trade Statistics 2026
Reuse and attribution
Reuse of the original data is governed by each source agency's own terms. No single licence applies to all sources.
When reusing figures from this page, please credit both sources:
- this analysis, with a link to the study page;
- the original agency (World Bank WITS / UN Comtrade, PBS or FBR).
Frequently asked questions
How much did Pakistan export under HS 901890 in 2025?
Pakistan reported gross exports of USD 446.50 million in calendar 2025, up 0.04% on 2024. The category is broad. It covers medical, surgical and veterinary instruments and appliances not classified elsewhere, not only handheld surgical instruments.
Is HS 901849 the total for Pakistan's dental instrument exports?
No. HS 901849 covers other instruments and appliances used in dental sciences. It excludes dental drill engines (HS 901841) and does not represent every dental product. Its 2025 value was USD 1.86 million.
Did Pakistan's dental instrument industry collapse after 2016?
The data do not show that. The recorded value under HS 901849 fell sharply between 2016 and 2017, but this study has not established the cause. These figures describe one customs category, not industry output.
Which destinations matter most?
For HS 901890 in 2025, the United States, Germany and the United Kingdom together accounted for 49.87% of value. For HS 901849, China alone accounted for 45.35%. China, the United Arab Emirates and Oman together accounted for 66.84%.
Why do the PBS figures differ from the WITS figures?
They measure different things:
- Periods: PBS uses fiscal years (July–June); WITS uses calendar years.
- Currency: the PCT detail is in Pakistani rupees, while WITS is in US dollars.
- Coverage: the PBS “surgical goods & medical instruments” group has an unconfirmed product mapping.
Keep the series separate. Do not add them together.
Are these figures adjusted for inflation, and are they final?
All values are nominal, with no inflation adjustment. Figures may be revised by the original agencies. Whether a given figure is final, revised or provisional depends on its original release. This study reflects sources as retrieved on 24 October 2026.
How should I cite this study?
Use the citation provided below the article. Name the original agency alongside Dental Instruments Supplier, and state the HS code, the period and the currency for any figure you quote.
Cite this analysis
Dental Instruments Supplier (2026). Pakistan Dental and Surgical Instrument Export Statistics 2026. Descriptive secondary analysis of World Bank WITS / UN Comtrade Pakistan-reported gross exports (HS 1988/92 H0, subheadings 901849 and 901890, calendar years 2015–2025). The analysis also uses Pakistan Bureau of Statistics PCT export detail (FY2023/24–FY2024/25) and Pakistan Bureau of Statistics monthly export releases (FY2025/26 and July–September 2026), with Federal Board of Revenue Pakistan Customs Tariff references. Sources retrieved 24 October 2026. https://dentalinstrumentssupplier.com/research/pakistan-dental-surgical-export-statistics-2026
Download the study and data
Download study packThe article, eleven CSV tables, chart images, definitions, source references and calculation records.
- annual exports 2015 2025 (CSV)
- export index (CSV)
- 901849 destinations 2024 2025 (CSV)
- 901849 growth contributions (CSV)
- 901890 destinations 2024 2025 (CSV)
- 901890 growth contributions (CSV)
- destination concentration (CSV)
- pct product comparison (CSV)
- pct country comparison (CSV)
- pbs latest update (CSV)
- source observations (CSV)
- Source manifest and checksums (JSON)
- Calculation records (JSON)
- Data dictionary (JSON)