
Key findings
This study draws on three official data sources for Yorkshire and The Humber, the statistical region coded E12000003. Each source covers a different period and population, so we report the findings separately.
- Hospital extractions: In 2024/25 the region recorded 504.3 hospital tooth extraction episodes for decay per 100,000 people aged 0 to 19. The England rate was 250.5. The regional rate is about twice the England rate and is the highest of England's nine statistical regions. Episodes are not unique children, and recording practices differ between areas.
- Decay in 5-year-olds: The 2024 survey estimated that 27.5% of 5-year-olds in the region had experience of dentinal decay. The England figure was 22.4%. Only 9 of the region's 15 councils took part.
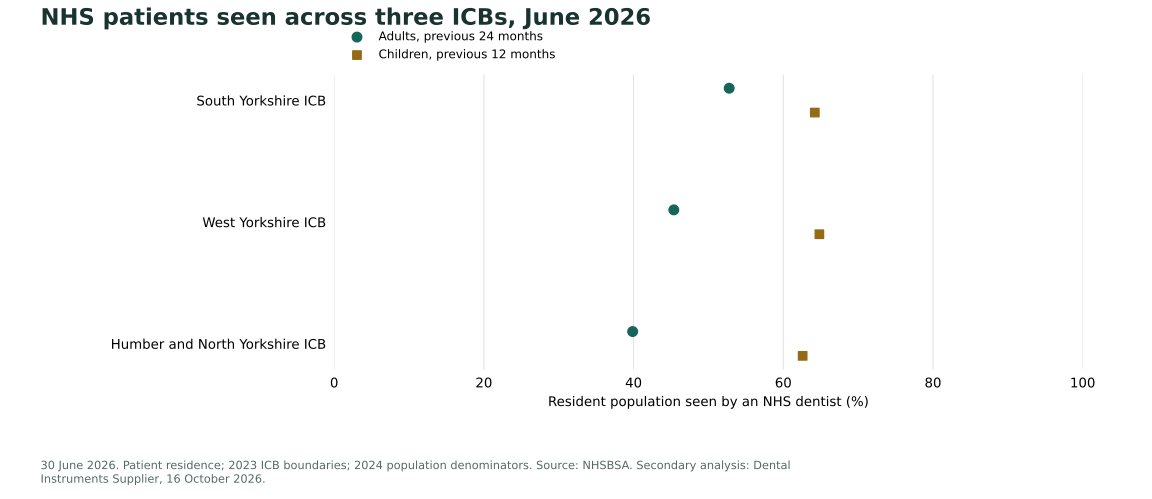
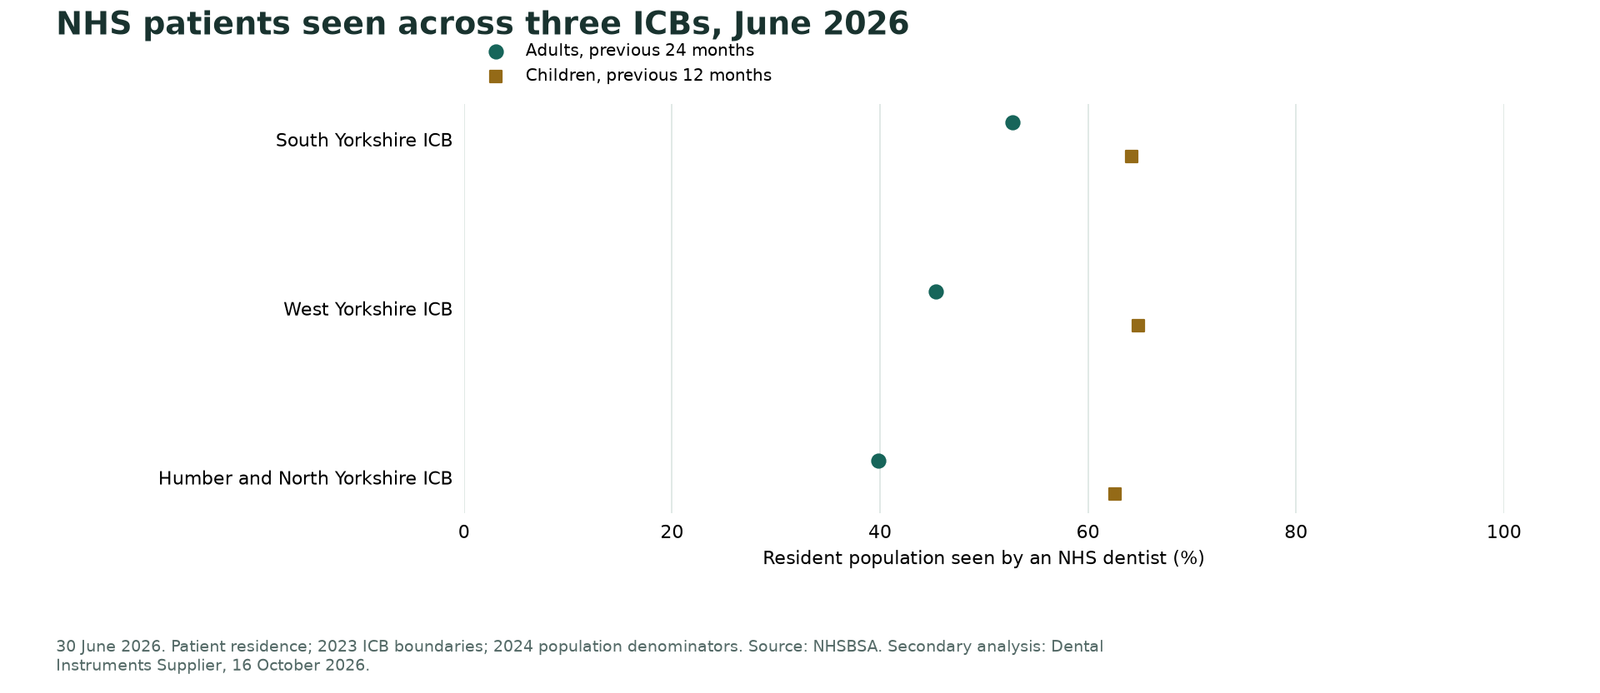
- NHS patients seen, by integrated care board (ICB): In the 24 months to 30 June 2026, the share of adults seen ranged from 39.9% in Humber and North Yorkshire to 52.8% in South Yorkshire. The child figures for the three ICBs had a spread of 2.23 percentage points.
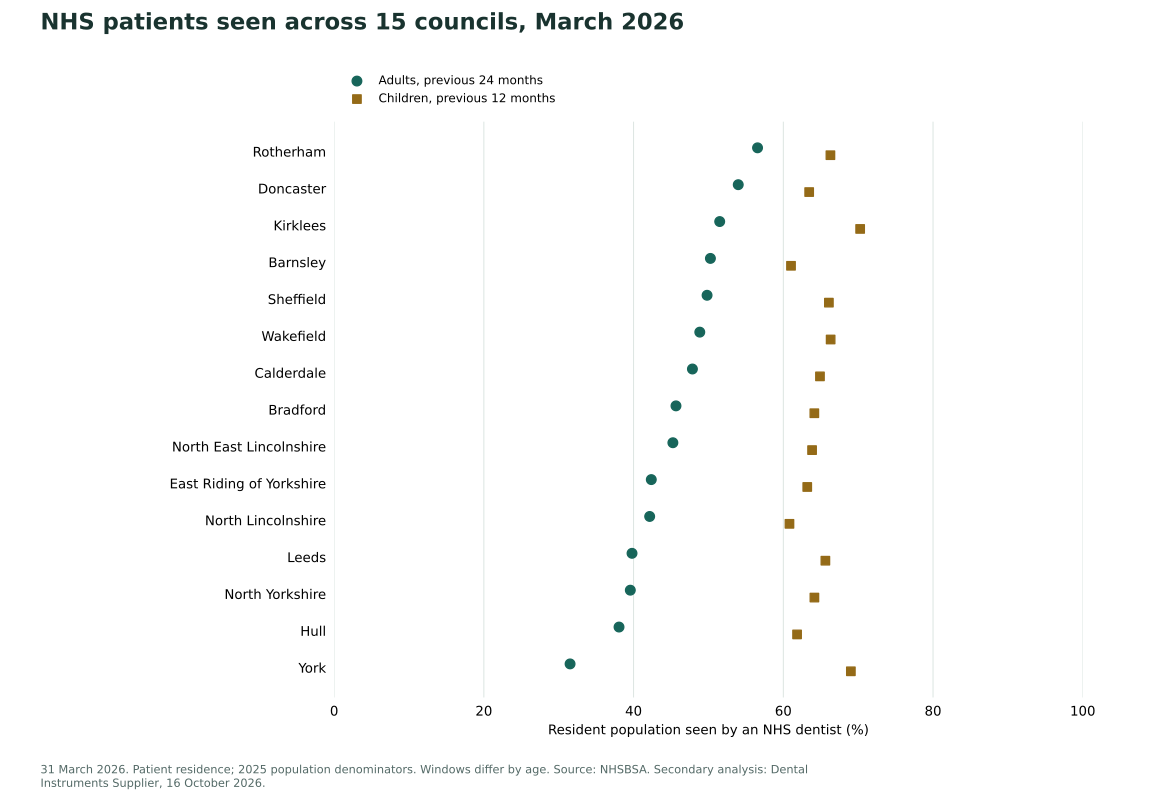
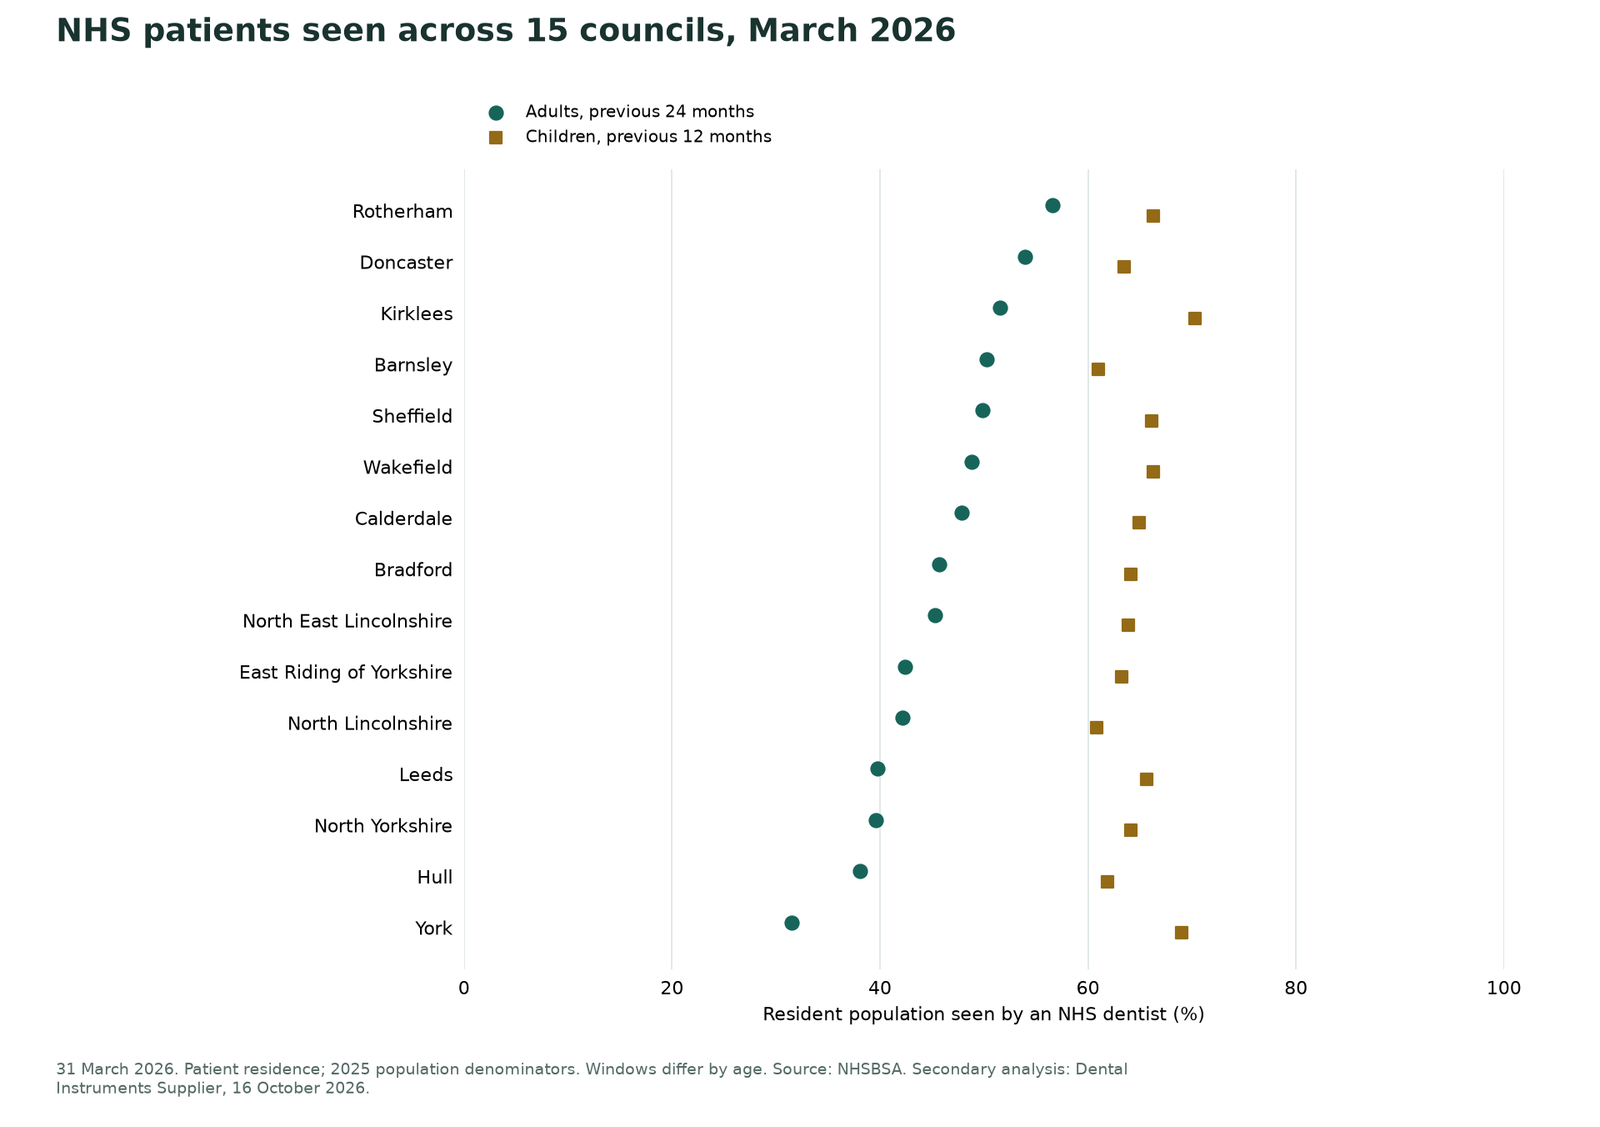
- NHS patients seen, by council: At 31 March 2026, the share of adults seen ranged from 31.5% in York to 56.6% in Rotherham. Being counted as 'not seen' does not mean a person was refused care.
None of these figures measures the quality of local dental services. The data also do not explain why areas differ.
What area this study covers
In this study, 'Yorkshire' means Yorkshire and The Humber, the statistical region used in official statistics. The region includes North Lincolnshire and North East Lincolnshire. It is not the same as the historic county of Yorkshire. It is also not the same as the NHS North East and Yorkshire region.
The region has 15 upper-tier councils: Barnsley, Bradford, Calderdale, Doncaster, East Riding of Yorkshire, Hull, Kirklees, Leeds, North East Lincolnshire, North Lincolnshire, North Yorkshire, Rotherham, Sheffield, Wakefield and York.
The NHS patient data are also published for three ICBs: Humber and North Yorkshire, West Yorkshire and South Yorkshire. We report each of these ICBs individually. This study does not calculate a combined regional patient rate.
This is the 2026 edition of the study. The year refers to when we published it, not to when the data were collected. The latest official releases cover different periods: hospital data for 2024/25, survey fieldwork in 2023/24, and NHS patient data to March and June 2026.
Hospital tooth extractions in children and young people
The Office for Health Improvement and Disparities (OHID) publishes annual data on hospital tooth extractions in 0 to 19 year olds. The latest release was published on 17 February 2026 and covers 1 April 2024 to 31 March 2025.
The measure counts finished consultant episodes (FCEs) in hospital where a tooth was extracted and the primary diagnosis was tooth decay. Rates are crude rates per 100,000 resident population aged 0 to 19. They use ONS mid-2024 population estimates.
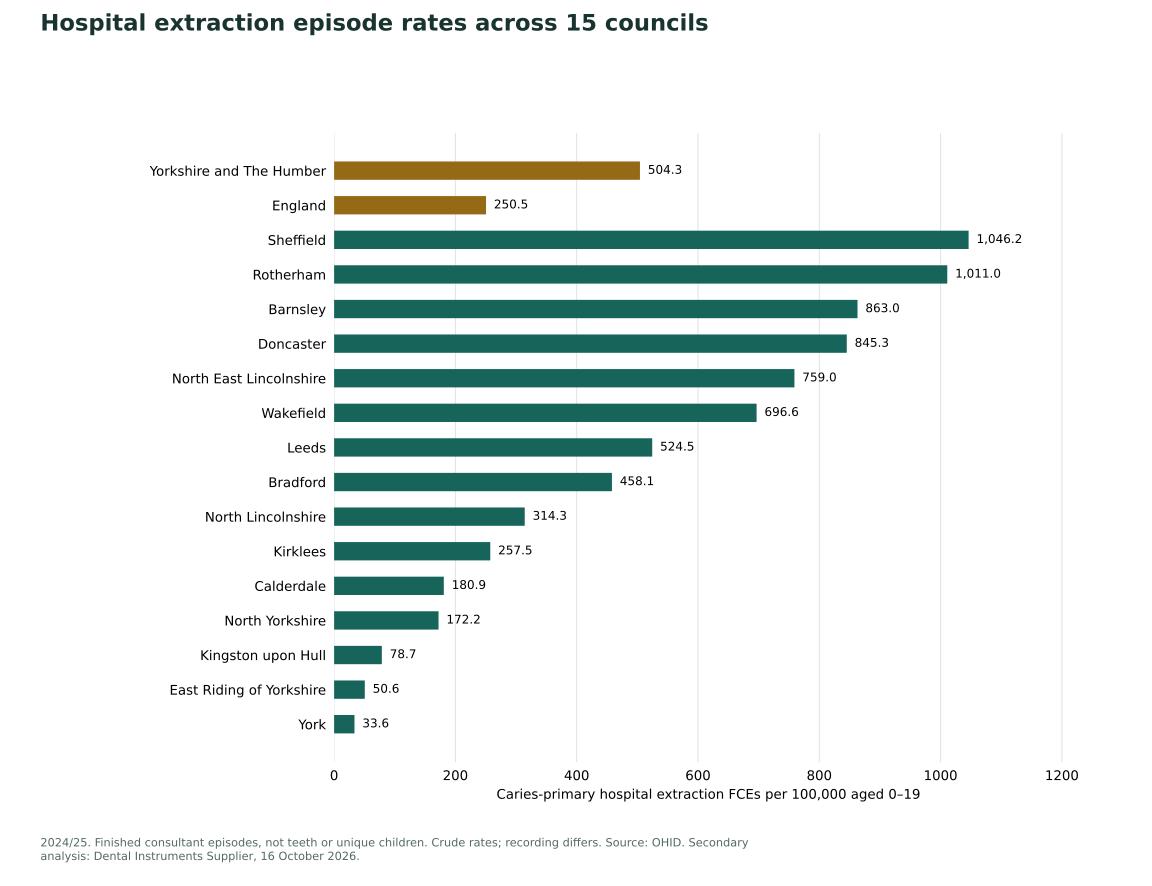
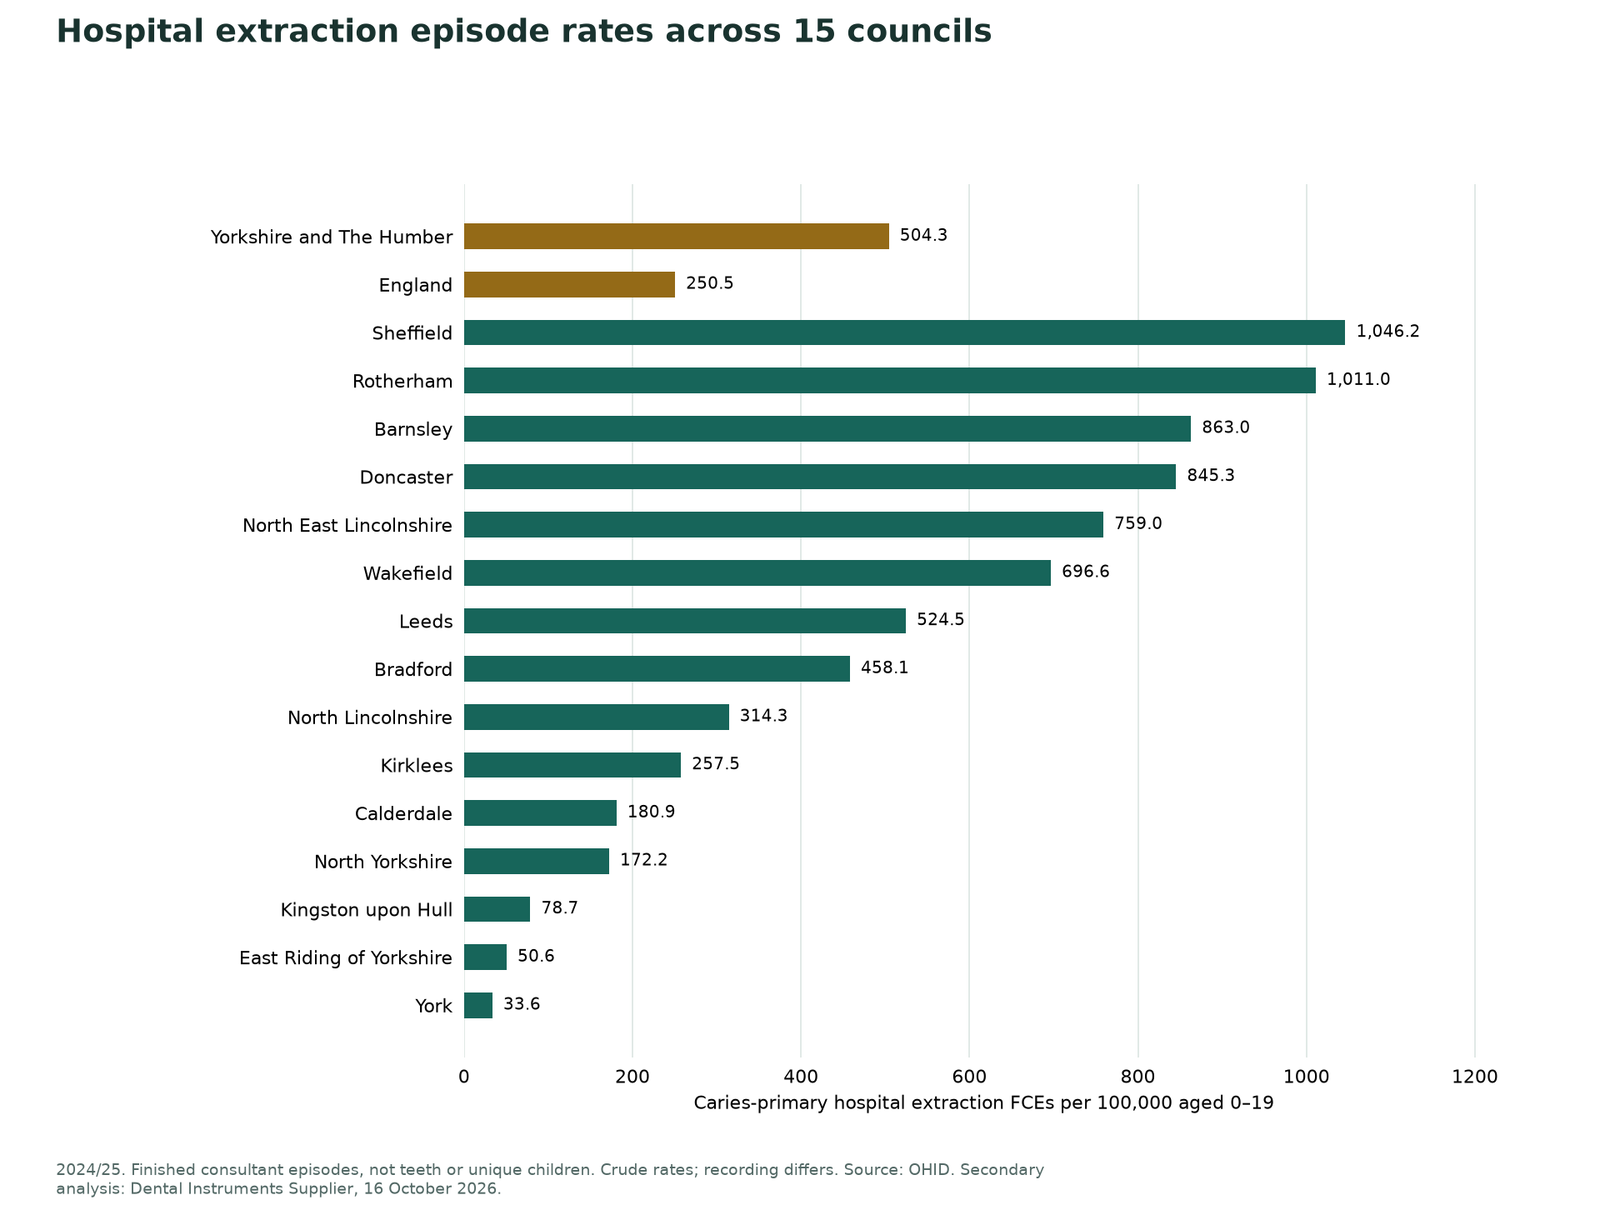
In Yorkshire and The Humber the rate was 504.3 per 100,000, compared with 250.5 for England. That is about 2.0 times the England rate, or 253.8 more episodes per 100,000. It was the highest published rate among the nine statistical regions.
The region recorded 6,675 episodes, a figure OHID rounds to the nearest 5. England recorded 33,976 episodes.
Council rates ranged from 33.6 per 100,000 in York to 1,046.2 per 100,000 in Sheffield. Ten of the 15 councils had rates above the England rate.
This range should not be read as a league table of decay. OHID's data quality notes explain that hospital coding and recording differ between areas. Extractions carried out by community dental services may not appear in hospital data. Some local variation may therefore reflect where and how treatment is recorded.
An episode is not the same as a child, an admission or a tooth. One child can account for more than one episode, and we do not assume that every episode involved a general anaesthetic. The rates are not age-standardised. OHID publishes no confidence intervals for them, so we make no claims about statistical significance.
Hospital extraction episode rates across 15 councils

| Area | FCE rate per 100,000 aged 0–19 | Published episodes |
|---|---|---|
| England | 250.5 | 33,976 |
| Yorkshire and The Humber | 504.3 | 6,675 |
| Kingston upon Hull | 78.7 | 55 |
| East Riding of Yorkshire | 50.6 | 35 |
| North East Lincolnshire | 759.0 | 280 |
| North Lincolnshire | 314.3 | 120 |
| York | 33.6 | 15 |
| North Yorkshire | 172.2 | 220 |
| Barnsley | 863.0 | 490 |
| Doncaster | 845.3 | 630 |
| Rotherham | 1,011.0 | 660 |
| Sheffield | 1,046.2 | 1,415 |
| Bradford | 458.1 | 720 |
| Calderdale | 180.9 | 90 |
| Kirklees | 257.5 | 285 |
| Leeds | 524.5 | 1,065 |
| Wakefield | 696.6 | 590 |
Tooth decay in 5-year-olds
OHID's oral health survey of 5-year-old schoolchildren 2024 is part of the National Dental Epidemiology Programme (NDEP). Fieldwork took place in the 2023/24 academic year, and results were released on 11 February 2025. We use the corrected version 2.0 of the results.
The measure is the share of children with experience of dentinal decay in their primary (baby) teeth. It counts teeth that are decayed into the dentine, missing because of decay, or filled because of decay. Decay that affects only the enamel is not included.
In Yorkshire and The Humber, 27.5% of 5-year-olds had experience of dentinal decay (95% confidence interval 26.05% to 29.00%). The England figure was 22.4% (22.11% to 22.68%). Based on these published rounded estimates, the regional figure was 5.1 percentage points higher.
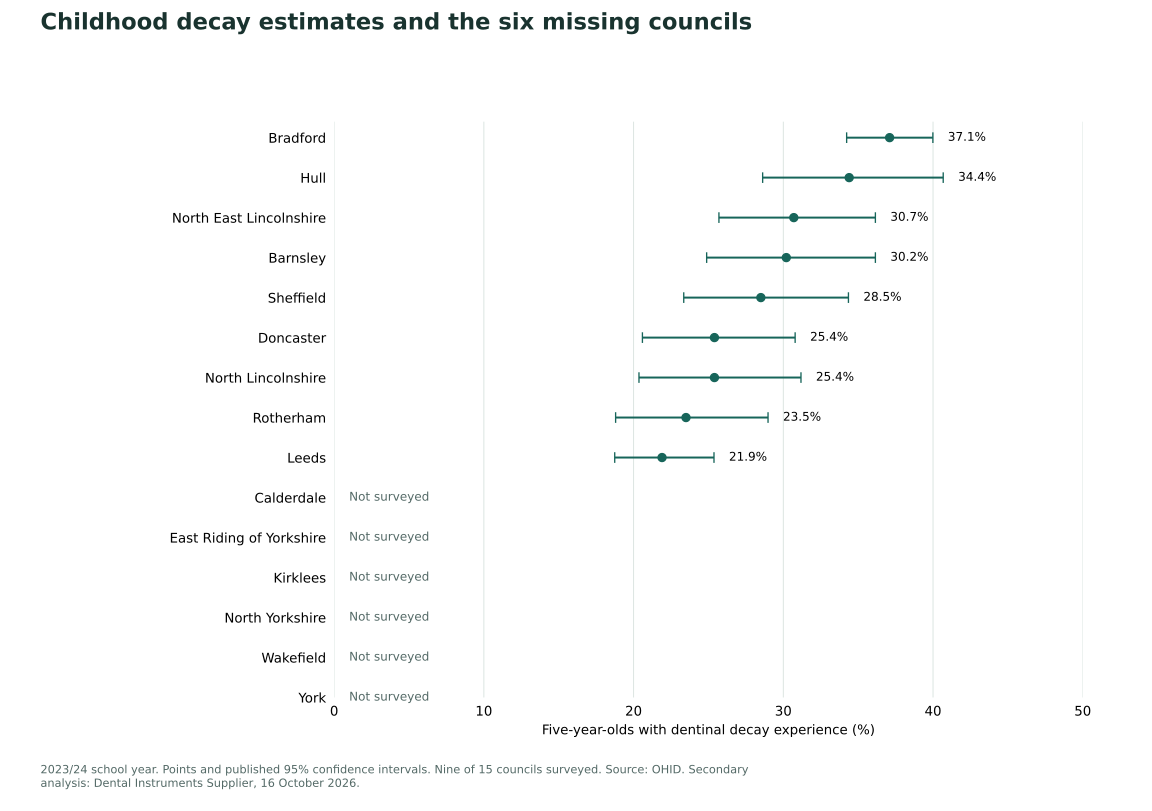
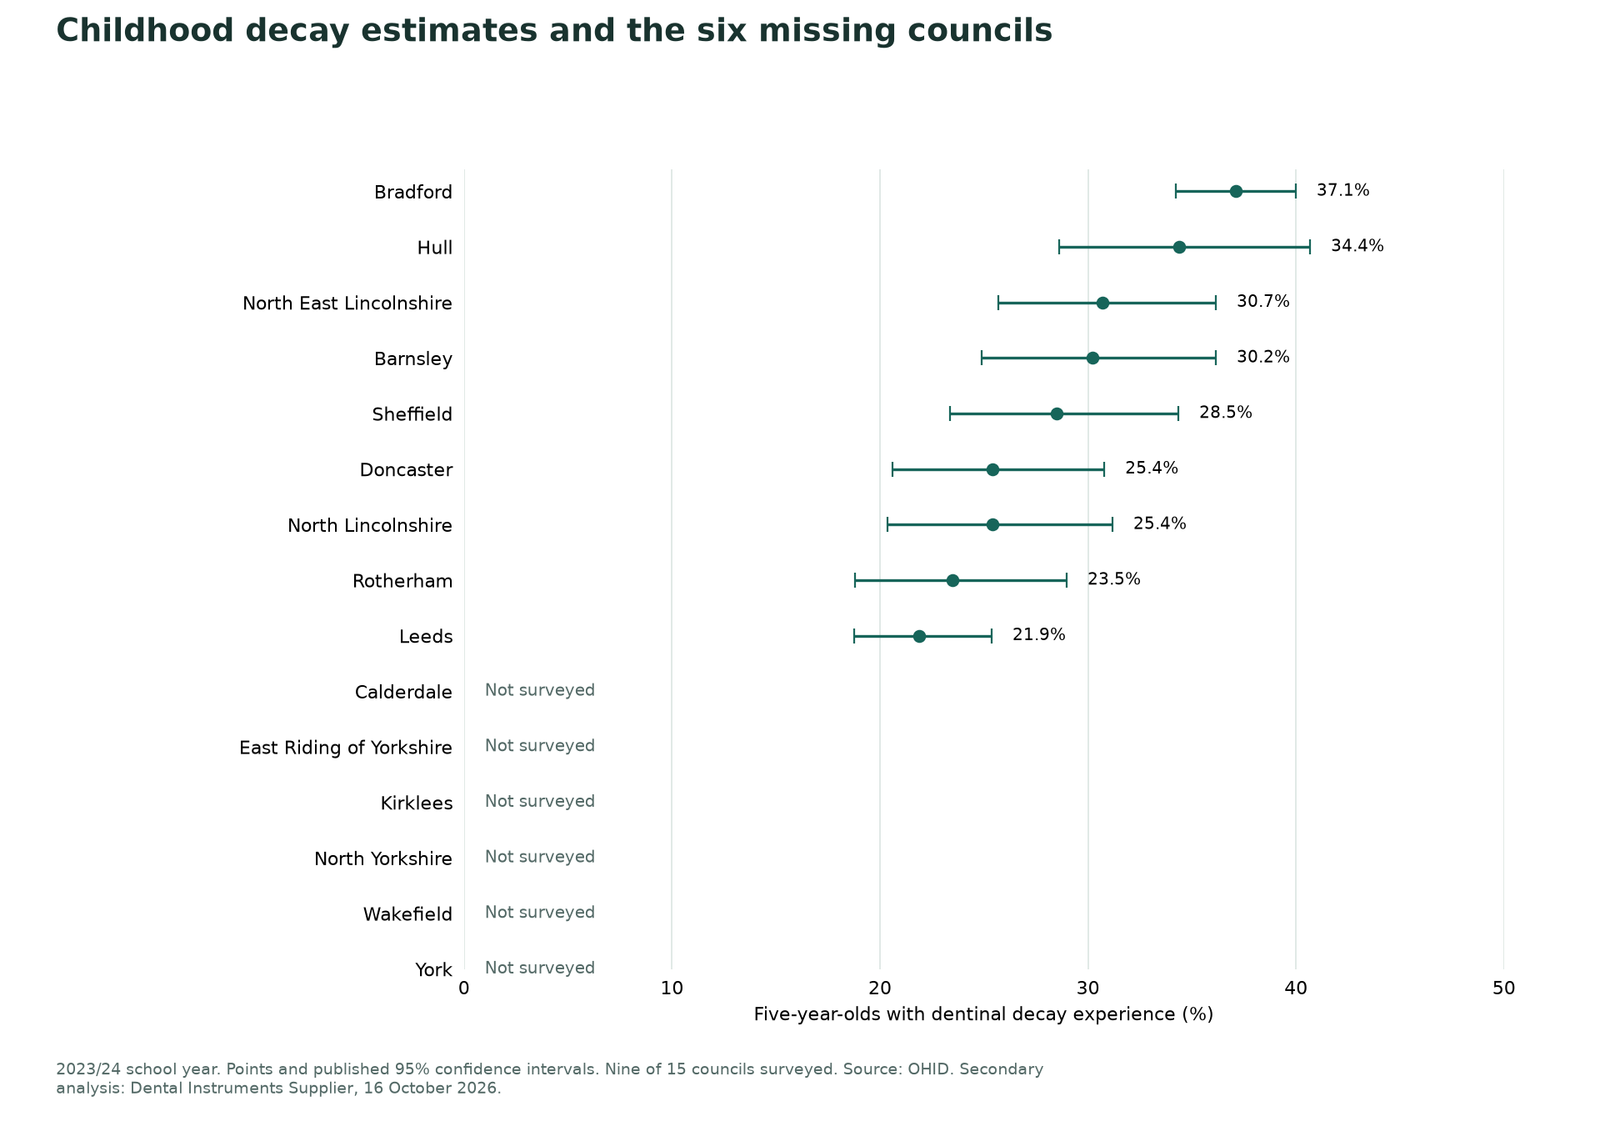
Only 9 of the 15 councils took part. Calderdale, East Riding of Yorkshire, Kirklees, North Yorkshire, Wakefield and York have no 2024 figures. We have not filled these gaps with zeros or estimates.
Among the nine participating councils, Bradford had the highest figure at 37.1% (34.23% to 39.99%). Leeds had the lowest at 21.9% (18.74% to 25.37%). The difference is 15.2 percentage points. Because six councils are missing, this is not a ranking of all 15 councils.
The survey covered children aged 5 but not yet 6 in mainstream state-funded schools, where parents gave written agreement. Results are weighted by deprivation quintile. The regional estimate is published by OHID and is not a simple average of the nine council figures.
The survey required written parental consent, so children whose parents did not consent or respond were not examined. These children may differ from those examined, which could bias the estimates, as the official NDEP report warns. Weighting and the published 95% confidence intervals do not remove this limitation.
Childhood decay estimates and the six missing councils

| Council | Dentinal decay experience (%) | Published 95% CI (%) | Children examined |
|---|---|---|---|
| Barnsley | 30.2 | 24.88 to 36.15 | 252 |
| Bradford | 37.1 | 34.23 to 39.99 | 1079 |
| Calderdale | Not surveyed | Not surveyed | Not surveyed |
| Doncaster | 25.4 | 20.59 to 30.79 | 277 |
| East Riding of Yorkshire | Not surveyed | Not surveyed | Not surveyed |
| Kingston upon Hull, City of | 34.4 | 28.62 to 40.68 | 235 |
| Kirklees | Not surveyed | Not surveyed | Not surveyed |
| Leeds | 21.9 | 18.74 to 25.37 | 595 |
| North East Lincolnshire | 30.7 | 25.70 to 36.15 | 296 |
| North Lincolnshire | 25.4 | 20.36 to 31.18 | 246 |
| North Yorkshire | Not surveyed | Not surveyed | Not surveyed |
| Rotherham | 23.5 | 18.80 to 28.98 | 264 |
| Sheffield | 28.5 | 23.35 to 34.35 | 256 |
| Wakefield | Not surveyed | Not surveyed | Not surveyed |
| York | Not surveyed | Not surveyed | Not surveyed |
NHS dental patients seen by integrated care board
The NHS Business Services Authority (NHSBSA) publishes Dental Statistics for England 2025/26. The release was published on 27 August 2026 and updated on 24 September 2026. Patients are counted by the postcode where they live, not by the location of the dental practice.
Adults aged 18 and over are counted if they were seen in the previous 24 months. Children aged 0 to 17 are counted if they were seen in the previous 12 months. The figures include orthodontic treatment. They exclude private dental care and hospital dental activity.
The latest ICB figures are for 30 June 2026. They come from monthly data for 2026/27, which so far covers April, May and June. As in the release, they use 2023 ICB boundaries. The denominators are ONS 2024 population estimates.
For adults, the share seen in the 24 months to 30 June 2026 was 39.9% in Humber and North Yorkshire ICB, 45.4% in West Yorkshire ICB and 52.8% in South Yorkshire ICB. The gap between the highest and lowest was 12.90 percentage points.
For children, the share seen in the 12 months to 30 June 2026 was 62.6% in Humber and North Yorkshire, 64.8% in West Yorkshire and 64.2% in South Yorkshire. The spread was 2.23 percentage points.
The adult and child figures use different time windows, so they cannot be compared directly. The data do not measure waiting times or unmet need.
NHS patients seen across three ICBs, June 2026

| Area | Adults seen, 24 months (%) | Children seen, 12 months (%) |
|---|---|---|
| Humber and North Yorkshire ICB | 39.88 | 62.59 |
| West Yorkshire ICB | 45.38 | 64.82 |
| South Yorkshire ICB | 52.78 | 64.21 |
NHS dental patients seen by council area
NHSBSA also publishes annual council figures for 31 March 2026. Counts are in tables 3b and 3c, and populations and percentages are in tables 3f and 3g, of its patient geography workbook. These figures use ONS 2025 population estimates and the same 24-month adult and 12-month child windows.
Across the 15 councils, the share of adults seen ranged from 31.5% in York to 56.6% in Rotherham. The gap was 25.04 percentage points.
The share of children seen ranged from 60.8% in North Lincolnshire to 70.3% in Kirklees. The gap was 9.44 percentage points.
The March 2026 council figures and the June 2026 ICB figures are separate snapshots. They have different end dates and population bases, so they do not show a change over time.
A person counted as 'not seen' may have used private care or may not have sought care. The figure does not mean the person was denied NHS treatment.
NHS patients seen across 15 councils, March 2026

| Area | Adults seen, 24 months (%) | Children seen, 12 months (%) |
|---|---|---|
| Kingston upon Hull, City of | 38.05 | 61.84 |
| East Riding of Yorkshire | 42.37 | 63.20 |
| North East Lincolnshire | 45.25 | 63.84 |
| North Lincolnshire | 42.15 | 60.82 |
| York | 31.52 | 69.02 |
| North Yorkshire | 39.56 | 64.15 |
| Doncaster | 53.98 | 63.45 |
| Rotherham | 56.56 | 66.29 |
| Bradford | 45.66 | 64.14 |
| Calderdale | 47.86 | 64.90 |
| Kirklees | 51.50 | 70.26 |
| Leeds | 39.79 | 65.62 |
| Wakefield | 48.84 | 66.32 |
| Barnsley | 50.26 | 61.03 |
| Sheffield | 49.82 | 66.09 |
How to read these figures together
The three sources answer different questions. The hospital data count treatment episodes. The survey estimates decay experience in one age group. The NHSBSA data count people seen in NHS primary care dentistry.
For this reason we show each source in its own panel. We have not joined the datasets, calculated correlations between them or built a combined score.
Hospital extraction rates should not be used to estimate how common decay is. Survey results do not measure access to care. Patient-seen percentages do not show who needed care.
The figures describe the latest published position. They do not show causes, judge service quality or predict future trends.
For national context, see our separate study of NHS dental statistics for England 2025/26.
Methods and limitations
This is a descriptive secondary analysis of published official statistics by Dental Instruments Supplier, a dental instrument business based in Sialkot, Pakistan. It is not an official NHS or OHID publication. It is also not clinical research, an audit of care quality or a survey we conducted. We did not carry out interviews or collect new data.
Calculations
- Percentage seen: patients seen divided by resident population, multiplied by 100.
- ICB percentages: we summed the counts and populations across the 4 adult and 18 child non-overlapping age bands before dividing. We did not average published percentages.
- Gaps in patients seen: the highest exact percentage minus the lowest exact percentage. Results were rounded to two decimal places after subtraction, so they may differ slightly from the difference between the one-decimal percentages shown.
- Rate ratio and difference: the published regional rate divided by the published England rate, or the England rate subtracted from the regional rate. Both published rates are already rounded to one decimal place, so the ratio is approximate.
Data handling
- We use hospital rates as published and do not rebuild them from rounded counts. Counts below national level are rounded to the nearest 5, and values from 0 to 7 are suppressed.
- Confidence intervals are shown only for the survey. These are OHID's published Wilson 95% intervals. We did no further significance testing.
- The published regional survey figure shows 3,523 children examined. The council counts displayed in the source total 3,500. We have not reconciled this source aggregation difference. We report the regional figure as published.
- Barnsley and Sheffield use the codes E08000016 and E08000019 in the OHID data, but E08000038 and E08000039 in the NHSBSA data. We keep each source's own codes.
- The downloads with this study list source columns, periods and units, with values at the full precision available.
NHSBSA's identification of patients is approximate. Its patient identity match uses surname, first initial, gender and date of birth. NHSBSA estimates that duplication or omission is unlikely to affect overall counts by more than 1% to 2%. The patients-seen figures are therefore close estimates, not a perfect count of unique individuals.
Research and calculations were prepared with the help of ChatGPT and Codex. This text was drafted with Claude Opus 5.5. All sources were retrieved on 16 October 2026.
Contains public sector information licensed under the Open Government Licence v3.0. The secondary calculations are our own. No affiliation with OHID, NHSBSA or the NHS, and no endorsement by them, is implied.
Sources and downloads
Hospital tooth extractions (OHID)
- Hospital tooth extractions in 0 to 19 year olds: 2025 (published 17 February 2026)
- Tidy data CSV, 2018 to 2025
- Data tables ODS, 2024 to 2025, version 1.1
- Methods for calculating numbers and rates
- Data quality and disclosure control
Oral health survey of 5-year-olds (OHID)
- Oral health survey of 5-year-old schoolchildren 2024 (released 11 February 2025)
- NDEP survey report and methods
- Results ODS, version 2.0
NHS dental patients seen (NHSBSA)
- Dental Statistics for England 2025/26 (published 27 August 2026, updated 24 September 2026)
- Patient geography workbook, tables 3b, 3c, 3f and 3g
- Patients seen by patient location, CSV archive 2019/20 to 2026/27
- Background information and methodology
- Notices of correction
All sources were retrieved on 16 October 2026.
Frequently asked questions
Does a high extraction rate mean more children have tooth decay?
Not necessarily. Extraction rates count hospital episodes, and they are affected by how areas code and record treatment. The survey is the better guide to decay experience, but it covers only 5-year-olds in participating areas.
Why are some councils missing from the survey figures?
Six councils did not take part in the 2024 survey, so OHID published no figures for them. We have left these areas blank.
Does 'not seen' mean people could not get an NHS dentist?
No. The figure shows only who was not recorded as seen by an NHS dentist in the time window. Some people use private care and some do not seek care. The data do not measure waiting times or unmet need.
Does this study calculate a combined regional patient rate?
No. We present the three ICBs individually. A combined rate would require verified boundary alignment and the sums of matching patient counts and populations, not an average of the published percentages.
Why does a 2026 study use data from 2023/24 and 2024/25?
The study is named after the year it was published. It uses the latest official release for each source, and those releases cover earlier periods.
Cite this analysis
Dental Instruments Supplier (2026). Yorkshire Dental Statistics 2026: Hospital Extractions, Childhood Decay and NHS Patients Seen. Secondary analysis of official statistics from the Office for Health Improvement and Disparities and the NHS Business Services Authority. Source licensing applies: source data are used under the Open Government Licence v3.0. Sources retrieved and analysis published 16 October 2026. https://dentalinstrumentssupplier.com/research/yorkshire-dental-statistics-2026
Download the study and data
Download study packArticle, four CSV tables, original chart images, methods, source references and calculation records.